
Search for Indicators
Addressing Mental Health and Substance Use Across the Lifespan
This is a priority based on the 2022-2024 Community Health Needs Assessment, which includes:
- Adverse Childhood Experiences
- Substance Use
- Adolescent Health
- Education
- Housing Overcrowding
- Health and Wellness for Older Adults
Indicator Gauge Icon Legend
Legend Colors
Red is bad, green is good, blue is not statistically different/neutral.
Compared to Distribution
 the value is in the best half of communities.
 the value is in the 2nd worst quarter of communities.
 the value is in the worst quarter of communities.
Compared to Target
 meets target;
  does not meet target.
Compared to a Single Value
 lower than the comparison value;
 higher than the comparison value;
 not statistically different from comparison value.
Trend

 non-significant change over time;
 significant change over time;
  no change over time.
Compared to Prior Value
 higher than the previous measurement period;
 lower than the previous measurement period;
 no statistically different change from previous measurement period.
 Significantly better than the overall value
 Significantly worse than the overall value
 Significantly different than the overall value
 No significant difference with the overall value
 No data on significance available
Health / Alcohol & Drug Use
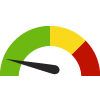
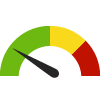
Adults who Binge Drink: Last 30 Days Census Tract: 06111004000
Adults who Binge Drink: Last 30 Days Census Tract: 06111004000
15.3%
(2021)
Compared to:
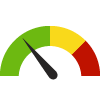
CA Census Tracts
The distribution is based on data from 8,005 California census tracts.
U.S. Census Tracts
The distribution is based on data from 68,167 U.S. census tracts.
Ventura, CA County Value
(15.5%)
The regional value is compared to the Ventura County value.
US Value
(15.5%)
The regional value is compared to the national value.
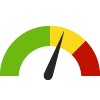
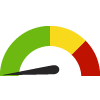
Adults who Binge Drink: Last 30 Days Census Tract: 06111004101
Adults who Binge Drink: Last 30 Days Census Tract: 06111004101
16.8%
(2021)
Compared to:
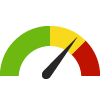

CA Census Tracts
The distribution is based on data from 8,005 California census tracts.
U.S. Census Tracts
The distribution is based on data from 68,167 U.S. census tracts.
Ventura, CA County Value
(15.5%)
The regional value is compared to the Ventura County value.
US Value
(15.5%)
The regional value is compared to the national value.
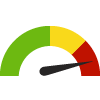
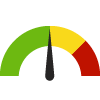
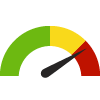
Adults who Binge Drink: Last 30 Days Census Tract: 06111004200
Adults who Binge Drink: Last 30 Days Census Tract: 06111004200
16.7%
(2021)
Compared to:
CA Census Tracts
The distribution is based on data from 8,005 California census tracts.
U.S. Census Tracts
The distribution is based on data from 68,167 U.S. census tracts.
Ventura, CA County Value
(15.5%)
The regional value is compared to the Ventura County value.
US Value
(15.5%)
The regional value is compared to the national value.
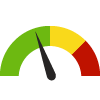
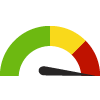
Adults who Binge Drink: Last 30 Days Census Tract: 06111004304
Adults who Binge Drink: Last 30 Days Census Tract: 06111004304
15.2%
(2021)
Compared to:
CA Census Tracts
The distribution is based on data from 8,005 California census tracts.
U.S. Census Tracts
The distribution is based on data from 68,167 U.S. census tracts.
Ventura, CA County Value
(15.5%)
The regional value is compared to the Ventura County value.
US Value
(15.5%)
The regional value is compared to the national value.
Adults who Binge Drink: Last 30 Days Census Tract: 06111004305
Adults who Binge Drink: Last 30 Days Census Tract: 06111004305
24.7%
(2021)
Compared to:
CA Census Tracts
The distribution is based on data from 8,005 California census tracts.
U.S. Census Tracts
The distribution is based on data from 68,167 U.S. census tracts.
Ventura, CA County Value
(15.5%)
The regional value is compared to the Ventura County value.
US Value
(15.5%)
The regional value is compared to the national value.
Adults who Binge Drink: Last 30 Days Census Tract: 06111004400
Adults who Binge Drink: Last 30 Days Census Tract: 06111004400
16.0%
(2021)
Compared to:
CA Census Tracts
The distribution is based on data from 8,005 California census tracts.
U.S. Census Tracts
The distribution is based on data from 68,167 U.S. census tracts.
Ventura, CA County Value
(15.5%)
The regional value is compared to the Ventura County value.
US Value
(15.5%)
The regional value is compared to the national value.
Adults who Binge Drink: Last 30 Days Census Tract: 06111004503
Adults who Binge Drink: Last 30 Days Census Tract: 06111004503
15.3%
(2021)
Compared to:
CA Census Tracts
The distribution is based on data from 8,005 California census tracts.
U.S. Census Tracts
The distribution is based on data from 68,167 U.S. census tracts.
Ventura, CA County Value
(15.5%)
The regional value is compared to the Ventura County value.
US Value
(15.5%)
The regional value is compared to the national value.
Adults who Binge Drink: Last 30 Days Census Tract: 06111004504
Adults who Binge Drink: Last 30 Days Census Tract: 06111004504
14.5%
(2021)
Compared to:
CA Census Tracts
The distribution is based on data from 8,005 California census tracts.
U.S. Census Tracts
The distribution is based on data from 68,167 U.S. census tracts.
Ventura, CA County Value
(15.5%)
The regional value is compared to the Ventura County value.
US Value
(15.5%)
The regional value is compared to the national value.
Adults who Binge Drink: Last 30 Days Census Tract: 06111004505
Adults who Binge Drink: Last 30 Days Census Tract: 06111004505
16.1%
(2021)
Compared to:
CA Census Tracts
The distribution is based on data from 8,005 California census tracts.
U.S. Census Tracts
The distribution is based on data from 68,167 U.S. census tracts.
Ventura, CA County Value
(15.5%)
The regional value is compared to the Ventura County value.
US Value
(15.5%)
The regional value is compared to the national value.
Adults who Binge Drink: Last 30 Days Census Tract: 06111004506
Adults who Binge Drink: Last 30 Days Census Tract: 06111004506
14.9%
(2021)
Compared to:
CA Census Tracts
The distribution is based on data from 8,005 California census tracts.
U.S. Census Tracts
The distribution is based on data from 68,167 U.S. census tracts.
Ventura, CA County Value
(15.5%)
The regional value is compared to the Ventura County value.
US Value
(15.5%)
The regional value is compared to the national value.
Adults who Binge Drink: Last 30 Days Census Tract: 06111004600
Adults who Binge Drink: Last 30 Days Census Tract: 06111004600
23.6%
(2021)
Compared to:
CA Census Tracts
The distribution is based on data from 8,005 California census tracts.
U.S. Census Tracts
The distribution is based on data from 68,167 U.S. census tracts.
Ventura, CA County Value
(15.5%)
The regional value is compared to the Ventura County value.
US Value
(15.5%)
The regional value is compared to the national value.
Adults who Binge Drink: Last 30 Days Census Tract: 06111004704
Adults who Binge Drink: Last 30 Days Census Tract: 06111004704
15.8%
(2021)
Compared to:
CA Census Tracts
The distribution is based on data from 8,005 California census tracts.
U.S. Census Tracts
The distribution is based on data from 68,167 U.S. census tracts.
Ventura, CA County Value
(15.5%)
The regional value is compared to the Ventura County value.
US Value
(15.5%)
The regional value is compared to the national value.
Adults who Binge Drink: Last 30 Days Census Tract: 06111004710
Adults who Binge Drink: Last 30 Days Census Tract: 06111004710
15.1%
(2021)
Compared to:
CA Census Tracts
The distribution is based on data from 8,005 California census tracts.
U.S. Census Tracts
The distribution is based on data from 68,167 U.S. census tracts.
Ventura, CA County Value
(15.5%)
The regional value is compared to the Ventura County value.
US Value
(15.5%)
The regional value is compared to the national value.
Adults who Binge Drink: Last 30 Days Census Tract: 06111004711
Adults who Binge Drink: Last 30 Days Census Tract: 06111004711
12.4%
(2021)
Compared to:
CA Census Tracts
The distribution is based on data from 8,005 California census tracts.
U.S. Census Tracts
The distribution is based on data from 68,167 U.S. census tracts.
Ventura, CA County Value
(15.5%)
The regional value is compared to the Ventura County value.
US Value
(15.5%)
The regional value is compared to the national value.
Adults who Binge Drink: Last 30 Days Census Tract: 06111004715
Adults who Binge Drink: Last 30 Days Census Tract: 06111004715
16.3%
(2021)
Compared to:
CA Census Tracts
The distribution is based on data from 8,005 California census tracts.
U.S. Census Tracts
The distribution is based on data from 68,167 U.S. census tracts.
Ventura, CA County Value
(15.5%)
The regional value is compared to the Ventura County value.
US Value
(15.5%)
The regional value is compared to the national value.
Adults who Binge Drink: Last 30 Days Census Tract: 06111004716
Adults who Binge Drink: Last 30 Days Census Tract: 06111004716
16.4%
(2021)
Compared to:
CA Census Tracts
The distribution is based on data from 8,005 California census tracts.
U.S. Census Tracts
The distribution is based on data from 68,167 U.S. census tracts.
Ventura, CA County Value
(15.5%)
The regional value is compared to the Ventura County value.
US Value
(15.5%)
The regional value is compared to the national value.
Adults who Binge Drink: Last 30 Days Census Tract: 06111004717
Adults who Binge Drink: Last 30 Days Census Tract: 06111004717
15.6%
(2021)
Compared to:
CA Census Tracts
The distribution is based on data from 8,005 California census tracts.
U.S. Census Tracts
The distribution is based on data from 68,167 U.S. census tracts.
Ventura, CA County Value
(15.5%)
The regional value is compared to the Ventura County value.
US Value
(15.5%)
The regional value is compared to the national value.
Adults who Binge Drink: Last 30 Days Census Tract: 06111004901
Adults who Binge Drink: Last 30 Days Census Tract: 06111004901
18.4%
(2021)
Compared to:
CA Census Tracts
The distribution is based on data from 8,005 California census tracts.
U.S. Census Tracts
The distribution is based on data from 68,167 U.S. census tracts.
Ventura, CA County Value
(15.5%)
The regional value is compared to the Ventura County value.
US Value
(15.5%)
The regional value is compared to the national value.
Adults who Binge Drink: Last 30 Days Census Tract: 06111004902
Adults who Binge Drink: Last 30 Days Census Tract: 06111004902
15.2%
(2021)
Compared to:
CA Census Tracts
The distribution is based on data from 8,005 California census tracts.
U.S. Census Tracts
The distribution is based on data from 68,167 U.S. census tracts.
Ventura, CA County Value
(15.5%)
The regional value is compared to the Ventura County value.
US Value
(15.5%)
The regional value is compared to the national value.
Adults who Binge Drink: Last 30 Days Census Tract: 06111005002
Adults who Binge Drink: Last 30 Days Census Tract: 06111005002
16.5%
(2021)
Compared to:
CA Census Tracts
The distribution is based on data from 8,005 California census tracts.
U.S. Census Tracts
The distribution is based on data from 68,167 U.S. census tracts.
Ventura, CA County Value
(15.5%)
The regional value is compared to the Ventura County value.
US Value
(15.5%)
The regional value is compared to the national value.
Adults who Binge Drink: Last 30 Days Census Tract: 06111005003
Adults who Binge Drink: Last 30 Days Census Tract: 06111005003
16.1%
(2021)
Compared to:
CA Census Tracts
The distribution is based on data from 8,005 California census tracts.
U.S. Census Tracts
The distribution is based on data from 68,167 U.S. census tracts.
Ventura, CA County Value
(15.5%)
The regional value is compared to the Ventura County value.
US Value
(15.5%)
The regional value is compared to the national value.
Adults who Binge Drink: Last 30 Days Census Tract: 06111005004
Adults who Binge Drink: Last 30 Days Census Tract: 06111005004
19.5%
(2021)
Compared to:
CA Census Tracts
The distribution is based on data from 8,005 California census tracts.
U.S. Census Tracts
The distribution is based on data from 68,167 U.S. census tracts.
Ventura, CA County Value
(15.5%)
The regional value is compared to the Ventura County value.
US Value
(15.5%)
The regional value is compared to the national value.
Adults who Binge Drink: Last 30 Days Census Tract: 06111005100
Adults who Binge Drink: Last 30 Days Census Tract: 06111005100
16.3%
(2021)
Compared to:
CA Census Tracts
The distribution is based on data from 8,005 California census tracts.
U.S. Census Tracts
The distribution is based on data from 68,167 U.S. census tracts.
Ventura, CA County Value
(15.5%)
The regional value is compared to the Ventura County value.
US Value
(15.5%)
The regional value is compared to the national value.
Adults who Binge Drink: Last 30 Days Census Tract: 06111005202
Adults who Binge Drink: Last 30 Days Census Tract: 06111005202
16.2%
(2021)
Compared to:
CA Census Tracts
The distribution is based on data from 8,005 California census tracts.
U.S. Census Tracts
The distribution is based on data from 68,167 U.S. census tracts.
Ventura, CA County Value
(15.5%)
The regional value is compared to the Ventura County value.
US Value
(15.5%)
The regional value is compared to the national value.
Adults who Binge Drink: Last 30 Days Census Tract: 06111005203
Adults who Binge Drink: Last 30 Days Census Tract: 06111005203
15.5%
(2021)
Compared to:
CA Census Tracts
The distribution is based on data from 8,005 California census tracts.
U.S. Census Tracts
The distribution is based on data from 68,167 U.S. census tracts.
Ventura, CA County Value
(15.5%)
The regional value is compared to the Ventura County value.
US Value
(15.5%)
The regional value is compared to the national value.
Adults who Binge Drink: Last 30 Days Census Tract: 06111005204
Adults who Binge Drink: Last 30 Days Census Tract: 06111005204
14.2%
(2021)
Compared to:
CA Census Tracts
The distribution is based on data from 8,005 California census tracts.
U.S. Census Tracts
The distribution is based on data from 68,167 U.S. census tracts.
Ventura, CA County Value
(15.5%)
The regional value is compared to the Ventura County value.
US Value
(15.5%)
The regional value is compared to the national value.
Adults who Binge Drink: Last 30 Days Census Tract: 06111005205
Adults who Binge Drink: Last 30 Days Census Tract: 06111005205
14.9%
(2021)
Compared to:
CA Census Tracts
The distribution is based on data from 8,005 California census tracts.
U.S. Census Tracts
The distribution is based on data from 68,167 U.S. census tracts.
Ventura, CA County Value
(15.5%)
The regional value is compared to the Ventura County value.
US Value
(15.5%)
The regional value is compared to the national value.
Adults who Binge Drink: Last 30 Days Census Tract: 06111005303
Adults who Binge Drink: Last 30 Days Census Tract: 06111005303
17.3%
(2021)
Compared to:
CA Census Tracts
The distribution is based on data from 8,005 California census tracts.
U.S. Census Tracts
The distribution is based on data from 68,167 U.S. census tracts.
Ventura, CA County Value
(15.5%)
The regional value is compared to the Ventura County value.
US Value
(15.5%)
The regional value is compared to the national value.
Adults who Binge Drink: Last 30 Days Census Tract: 06111005304
Adults who Binge Drink: Last 30 Days Census Tract: 06111005304
10.1%
(2021)
Compared to:
CA Census Tracts
The distribution is based on data from 8,005 California census tracts.
U.S. Census Tracts
The distribution is based on data from 68,167 U.S. census tracts.
Ventura, CA County Value
(15.5%)
The regional value is compared to the Ventura County value.
US Value
(15.5%)
The regional value is compared to the national value.
Adults who Binge Drink: Last 30 Days Census Tract: 06111005305
Adults who Binge Drink: Last 30 Days Census Tract: 06111005305
16.3%
(2021)
Compared to:
CA Census Tracts
The distribution is based on data from 8,005 California census tracts.
U.S. Census Tracts
The distribution is based on data from 68,167 U.S. census tracts.
Ventura, CA County Value
(15.5%)
The regional value is compared to the Ventura County value.
US Value
(15.5%)
The regional value is compared to the national value.
Adults who Binge Drink: Last 30 Days Census Tract: 06111005306
Adults who Binge Drink: Last 30 Days Census Tract: 06111005306
17.2%
(2021)
Compared to:
CA Census Tracts
The distribution is based on data from 8,005 California census tracts.
U.S. Census Tracts
The distribution is based on data from 68,167 U.S. census tracts.
Ventura, CA County Value
(15.5%)
The regional value is compared to the Ventura County value.
US Value
(15.5%)
The regional value is compared to the national value.
Adults who Binge Drink: Last 30 Days Census Tract: 06111005401
Adults who Binge Drink: Last 30 Days Census Tract: 06111005401
16.8%
(2021)
Compared to:
CA Census Tracts
The distribution is based on data from 8,005 California census tracts.
U.S. Census Tracts
The distribution is based on data from 68,167 U.S. census tracts.
Ventura, CA County Value
(15.5%)
The regional value is compared to the Ventura County value.
US Value
(15.5%)
The regional value is compared to the national value.
Adults who Binge Drink: Last 30 Days Census Tract: 06111005403
Adults who Binge Drink: Last 30 Days Census Tract: 06111005403
16.4%
(2021)
Compared to:
CA Census Tracts
The distribution is based on data from 8,005 California census tracts.
U.S. Census Tracts
The distribution is based on data from 68,167 U.S. census tracts.
Ventura, CA County Value
(15.5%)
The regional value is compared to the Ventura County value.
US Value
(15.5%)
The regional value is compared to the national value.
Adults who Binge Drink: Last 30 Days Census Tract: 06111005404
Adults who Binge Drink: Last 30 Days Census Tract: 06111005404
16.4%
(2021)
Compared to:
CA Census Tracts
The distribution is based on data from 8,005 California census tracts.
U.S. Census Tracts
The distribution is based on data from 68,167 U.S. census tracts.
Ventura, CA County Value
(15.5%)
The regional value is compared to the Ventura County value.
US Value
(15.5%)
The regional value is compared to the national value.
Adults who Binge Drink: Last 30 Days Census Tract: 06111005502
Adults who Binge Drink: Last 30 Days Census Tract: 06111005502
18.4%
(2021)
Compared to:
CA Census Tracts
The distribution is based on data from 8,005 California census tracts.
U.S. Census Tracts
The distribution is based on data from 68,167 U.S. census tracts.
Ventura, CA County Value
(15.5%)
The regional value is compared to the Ventura County value.
US Value
(15.5%)
The regional value is compared to the national value.
Adults who Binge Drink: Last 30 Days Census Tract: 06111005503
Adults who Binge Drink: Last 30 Days Census Tract: 06111005503
14.7%
(2021)
Compared to:
CA Census Tracts
The distribution is based on data from 8,005 California census tracts.
U.S. Census Tracts
The distribution is based on data from 68,167 U.S. census tracts.
Ventura, CA County Value
(15.5%)
The regional value is compared to the Ventura County value.
US Value
(15.5%)
The regional value is compared to the national value.
Adults who Binge Drink: Last 30 Days Census Tract: 06111005504
Adults who Binge Drink: Last 30 Days Census Tract: 06111005504
16.5%
(2021)
Compared to:
CA Census Tracts
The distribution is based on data from 8,005 California census tracts.
U.S. Census Tracts
The distribution is based on data from 68,167 U.S. census tracts.
Ventura, CA County Value
(15.5%)
The regional value is compared to the Ventura County value.
US Value
(15.5%)
The regional value is compared to the national value.
Adults who Binge Drink: Last 30 Days Census Tract: 06111005600
Adults who Binge Drink: Last 30 Days Census Tract: 06111005600
16.1%
(2021)
Compared to:
CA Census Tracts
The distribution is based on data from 8,005 California census tracts.
U.S. Census Tracts
The distribution is based on data from 68,167 U.S. census tracts.
Ventura, CA County Value
(15.5%)
The regional value is compared to the Ventura County value.
US Value
(15.5%)
The regional value is compared to the national value.
Adults who Binge Drink: Last 30 Days Census Tract: 06111005700
Adults who Binge Drink: Last 30 Days Census Tract: 06111005700
22.4%
(2021)
Compared to:
CA Census Tracts
The distribution is based on data from 8,005 California census tracts.
U.S. Census Tracts
The distribution is based on data from 68,167 U.S. census tracts.
Ventura, CA County Value
(15.5%)
The regional value is compared to the Ventura County value.
US Value
(15.5%)
The regional value is compared to the national value.
Adults who Binge Drink: Last 30 Days Census Tract: 06111005801
Adults who Binge Drink: Last 30 Days Census Tract: 06111005801
17.8%
(2021)
Compared to:
CA Census Tracts
The distribution is based on data from 8,005 California census tracts.
U.S. Census Tracts
The distribution is based on data from 68,167 U.S. census tracts.
Ventura, CA County Value
(15.5%)
The regional value is compared to the Ventura County value.
US Value
(15.5%)
The regional value is compared to the national value.
Adults who Binge Drink: Last 30 Days Census Tract: 06111005802
Adults who Binge Drink: Last 30 Days Census Tract: 06111005802
16.6%
(2021)
Compared to:
CA Census Tracts
The distribution is based on data from 8,005 California census tracts.
U.S. Census Tracts
The distribution is based on data from 68,167 U.S. census tracts.
Ventura, CA County Value
(15.5%)
The regional value is compared to the Ventura County value.
US Value
(15.5%)
The regional value is compared to the national value.
Adults who Binge Drink: Last 30 Days Census Tract: 06111005901
Adults who Binge Drink: Last 30 Days Census Tract: 06111005901
17.6%
(2021)
Compared to:
CA Census Tracts
The distribution is based on data from 8,005 California census tracts.
U.S. Census Tracts
The distribution is based on data from 68,167 U.S. census tracts.
Ventura, CA County Value
(15.5%)
The regional value is compared to the Ventura County value.
US Value
(15.5%)
The regional value is compared to the national value.
Adults who Binge Drink: Last 30 Days Census Tract: 06111005906
Adults who Binge Drink: Last 30 Days Census Tract: 06111005906
16.4%
(2021)
Compared to:
CA Census Tracts
The distribution is based on data from 8,005 California census tracts.
U.S. Census Tracts
The distribution is based on data from 68,167 U.S. census tracts.
Ventura, CA County Value
(15.5%)
The regional value is compared to the Ventura County value.
US Value
(15.5%)
The regional value is compared to the national value.
Adults who Binge Drink: Last 30 Days Census Tract: 06111005907
Adults who Binge Drink: Last 30 Days Census Tract: 06111005907
12.8%
(2021)
Compared to:
CA Census Tracts
The distribution is based on data from 8,005 California census tracts.
U.S. Census Tracts
The distribution is based on data from 68,167 U.S. census tracts.
Ventura, CA County Value
(15.5%)
The regional value is compared to the Ventura County value.
US Value
(15.5%)
The regional value is compared to the national value.
Adults who Binge Drink: Last 30 Days Census Tract: 06111005908
Adults who Binge Drink: Last 30 Days Census Tract: 06111005908
16.8%
(2021)
Compared to:
CA Census Tracts
The distribution is based on data from 8,005 California census tracts.
U.S. Census Tracts
The distribution is based on data from 68,167 U.S. census tracts.
Ventura, CA County Value
(15.5%)
The regional value is compared to the Ventura County value.
US Value
(15.5%)
The regional value is compared to the national value.
Adults who Binge Drink: Last 30 Days Census Tract: 06111005909
Adults who Binge Drink: Last 30 Days Census Tract: 06111005909
15.3%
(2021)
Compared to:
CA Census Tracts
The distribution is based on data from 8,005 California census tracts.
U.S. Census Tracts
The distribution is based on data from 68,167 U.S. census tracts.
Ventura, CA County Value
(15.5%)
The regional value is compared to the Ventura County value.
US Value
(15.5%)
The regional value is compared to the national value.
Adults who Binge Drink: Last 30 Days Census Tract: 06111005910
Adults who Binge Drink: Last 30 Days Census Tract: 06111005910
17.2%
(2021)
Compared to:
CA Census Tracts
The distribution is based on data from 8,005 California census tracts.
U.S. Census Tracts
The distribution is based on data from 68,167 U.S. census tracts.
Ventura, CA County Value
(15.5%)
The regional value is compared to the Ventura County value.
US Value
(15.5%)
The regional value is compared to the national value.
Adults who Binge Drink: Last 30 Days Census Tract: 06111005911
Adults who Binge Drink: Last 30 Days Census Tract: 06111005911
16.7%
(2021)
Compared to:
CA Census Tracts
The distribution is based on data from 8,005 California census tracts.
U.S. Census Tracts
The distribution is based on data from 68,167 U.S. census tracts.
Ventura, CA County Value
(15.5%)
The regional value is compared to the Ventura County value.
US Value
(15.5%)
The regional value is compared to the national value.
Adults who Binge Drink: Last 30 Days Census Tract: 06111006000
Adults who Binge Drink: Last 30 Days Census Tract: 06111006000
17.8%
(2021)
Compared to:
CA Census Tracts
The distribution is based on data from 8,005 California census tracts.
U.S. Census Tracts
The distribution is based on data from 68,167 U.S. census tracts.
Ventura, CA County Value
(15.5%)
The regional value is compared to the Ventura County value.
US Value
(15.5%)
The regional value is compared to the national value.
Adults who Binge Drink: Last 30 Days Census Tract: 06111006100
Adults who Binge Drink: Last 30 Days Census Tract: 06111006100
17.2%
(2021)
Compared to:
CA Census Tracts
The distribution is based on data from 8,005 California census tracts.
U.S. Census Tracts
The distribution is based on data from 68,167 U.S. census tracts.
Ventura, CA County Value
(15.5%)
The regional value is compared to the Ventura County value.
US Value
(15.5%)
The regional value is compared to the national value.
Adults who Binge Drink: Last 30 Days Census Tract: 06111006200
Adults who Binge Drink: Last 30 Days Census Tract: 06111006200
15.3%
(2021)
Compared to:
CA Census Tracts
The distribution is based on data from 8,005 California census tracts.
U.S. Census Tracts
The distribution is based on data from 68,167 U.S. census tracts.
Ventura, CA County Value
(15.5%)
The regional value is compared to the Ventura County value.
US Value
(15.5%)
The regional value is compared to the national value.
Adults who Binge Drink: Last 30 Days Census Tract: 06111006301
Adults who Binge Drink: Last 30 Days Census Tract: 06111006301
15.2%
(2021)
Compared to:
CA Census Tracts
The distribution is based on data from 8,005 California census tracts.
U.S. Census Tracts
The distribution is based on data from 68,167 U.S. census tracts.
Ventura, CA County Value
(15.5%)
The regional value is compared to the Ventura County value.
US Value
(15.5%)
The regional value is compared to the national value.
Adults who Binge Drink: Last 30 Days Census Tract: 06111006302
Adults who Binge Drink: Last 30 Days Census Tract: 06111006302
19.1%
(2021)
Compared to:
CA Census Tracts
The distribution is based on data from 8,005 California census tracts.
U.S. Census Tracts
The distribution is based on data from 68,167 U.S. census tracts.
Ventura, CA County Value
(15.5%)
The regional value is compared to the Ventura County value.
US Value
(15.5%)
The regional value is compared to the national value.
Adults who Binge Drink: Last 30 Days Census Tract: 06111006400
Adults who Binge Drink: Last 30 Days Census Tract: 06111006400
16.4%
(2021)
Compared to:
CA Census Tracts
The distribution is based on data from 8,005 California census tracts.
U.S. Census Tracts
The distribution is based on data from 68,167 U.S. census tracts.
Ventura, CA County Value
(15.5%)
The regional value is compared to the Ventura County value.
US Value
(15.5%)
The regional value is compared to the national value.
Adults who Binge Drink: Last 30 Days Census Tract: 06111006500
Adults who Binge Drink: Last 30 Days Census Tract: 06111006500
18.4%
(2021)
Compared to:
CA Census Tracts
The distribution is based on data from 8,005 California census tracts.
U.S. Census Tracts
The distribution is based on data from 68,167 U.S. census tracts.
Ventura, CA County Value
(15.5%)
The regional value is compared to the Ventura County value.
US Value
(15.5%)
The regional value is compared to the national value.
Adults who Binge Drink: Last 30 Days Census Tract: 06111006600
Adults who Binge Drink: Last 30 Days Census Tract: 06111006600
15.9%
(2021)
Compared to:
CA Census Tracts
The distribution is based on data from 8,005 California census tracts.
U.S. Census Tracts
The distribution is based on data from 68,167 U.S. census tracts.
Ventura, CA County Value
(15.5%)
The regional value is compared to the Ventura County value.
US Value
(15.5%)
The regional value is compared to the national value.
Adults who Binge Drink: Last 30 Days Census Tract: 06111006700
Adults who Binge Drink: Last 30 Days Census Tract: 06111006700
15.3%
(2021)
Compared to:
CA Census Tracts
The distribution is based on data from 8,005 California census tracts.
U.S. Census Tracts
The distribution is based on data from 68,167 U.S. census tracts.
Ventura, CA County Value
(15.5%)
The regional value is compared to the Ventura County value.
US Value
(15.5%)
The regional value is compared to the national value.
Adults who Binge Drink: Last 30 Days Census Tract: 06111006800
Adults who Binge Drink: Last 30 Days Census Tract: 06111006800
17.3%
(2021)
Compared to:
CA Census Tracts
The distribution is based on data from 8,005 California census tracts.
U.S. Census Tracts
The distribution is based on data from 68,167 U.S. census tracts.
Ventura, CA County Value
(15.5%)
The regional value is compared to the Ventura County value.
US Value
(15.5%)
The regional value is compared to the national value.
Adults who Binge Drink: Last 30 Days Census Tract: 06111006900
Adults who Binge Drink: Last 30 Days Census Tract: 06111006900
14.3%
(2021)
Compared to:
CA Census Tracts
The distribution is based on data from 8,005 California census tracts.
U.S. Census Tracts
The distribution is based on data from 68,167 U.S. census tracts.
Ventura, CA County Value
(15.5%)
The regional value is compared to the Ventura County value.
US Value
(15.5%)
The regional value is compared to the national value.
Adults who Binge Drink: Last 30 Days Census Tract: 06111007000
Adults who Binge Drink: Last 30 Days Census Tract: 06111007000
15.8%
(2021)
Compared to:
CA Census Tracts
The distribution is based on data from 8,005 California census tracts.
U.S. Census Tracts
The distribution is based on data from 68,167 U.S. census tracts.
Ventura, CA County Value
(15.5%)
The regional value is compared to the Ventura County value.
US Value
(15.5%)
The regional value is compared to the national value.
Adults who Binge Drink: Last 30 Days Census Tract: 06111007100
Adults who Binge Drink: Last 30 Days Census Tract: 06111007100
17.2%
(2021)
Compared to:
CA Census Tracts
The distribution is based on data from 8,005 California census tracts.
U.S. Census Tracts
The distribution is based on data from 68,167 U.S. census tracts.
Ventura, CA County Value
(15.5%)
The regional value is compared to the Ventura County value.
US Value
(15.5%)
The regional value is compared to the national value.
Adults who Binge Drink: Last 30 Days Census Tract: 06111007201
Adults who Binge Drink: Last 30 Days Census Tract: 06111007201
16.4%
(2021)
Compared to:
CA Census Tracts
The distribution is based on data from 8,005 California census tracts.
U.S. Census Tracts
The distribution is based on data from 68,167 U.S. census tracts.
Ventura, CA County Value
(15.5%)
The regional value is compared to the Ventura County value.
US Value
(15.5%)
The regional value is compared to the national value.
Adults who Binge Drink: Last 30 Days Census Tract: 06111007202
Adults who Binge Drink: Last 30 Days Census Tract: 06111007202
15.7%
(2021)
Compared to:
CA Census Tracts
The distribution is based on data from 8,005 California census tracts.
U.S. Census Tracts
The distribution is based on data from 68,167 U.S. census tracts.
Ventura, CA County Value
(15.5%)
The regional value is compared to the Ventura County value.
US Value
(15.5%)
The regional value is compared to the national value.
Adults who Binge Drink: Last 30 Days Census Tract: 06111007300
Adults who Binge Drink: Last 30 Days Census Tract: 06111007300
15.8%
(2021)
Compared to:
CA Census Tracts
The distribution is based on data from 8,005 California census tracts.
U.S. Census Tracts
The distribution is based on data from 68,167 U.S. census tracts.
Ventura, CA County Value
(15.5%)
The regional value is compared to the Ventura County value.
US Value
(15.5%)
The regional value is compared to the national value.
Adults who Binge Drink: Last 30 Days Census Tract: 06111007402
Adults who Binge Drink: Last 30 Days Census Tract: 06111007402
15.4%
(2021)
Compared to:
CA Census Tracts
The distribution is based on data from 8,005 California census tracts.
U.S. Census Tracts
The distribution is based on data from 68,167 U.S. census tracts.
Ventura, CA County Value
(15.5%)
The regional value is compared to the Ventura County value.
US Value
(15.5%)
The regional value is compared to the national value.
Adults who Binge Drink: Last 30 Days Census Tract: 06111007403
Adults who Binge Drink: Last 30 Days Census Tract: 06111007403
17.0%
(2021)
Compared to:
CA Census Tracts
The distribution is based on data from 8,005 California census tracts.
U.S. Census Tracts
The distribution is based on data from 68,167 U.S. census tracts.
Ventura, CA County Value
(15.5%)
The regional value is compared to the Ventura County value.
US Value
(15.5%)
The regional value is compared to the national value.
Adults who Binge Drink: Last 30 Days Census Tract: 06111007405
Adults who Binge Drink: Last 30 Days Census Tract: 06111007405
17.7%
(2021)
Compared to:
CA Census Tracts
The distribution is based on data from 8,005 California census tracts.
U.S. Census Tracts
The distribution is based on data from 68,167 U.S. census tracts.
Ventura, CA County Value
(15.5%)
The regional value is compared to the Ventura County value.
US Value
(15.5%)
The regional value is compared to the national value.
Adults who Binge Drink: Last 30 Days Census Tract: 06111007406
Adults who Binge Drink: Last 30 Days Census Tract: 06111007406
17.6%
(2021)
Compared to:
CA Census Tracts
The distribution is based on data from 8,005 California census tracts.
U.S. Census Tracts
The distribution is based on data from 68,167 U.S. census tracts.
Ventura, CA County Value
(15.5%)
The regional value is compared to the Ventura County value.
US Value
(15.5%)
The regional value is compared to the national value.
Adults who Binge Drink: Last 30 Days Census Tract: 06111007505
Adults who Binge Drink: Last 30 Days Census Tract: 06111007505
17.5%
(2021)
Compared to:
CA Census Tracts
The distribution is based on data from 8,005 California census tracts.
U.S. Census Tracts
The distribution is based on data from 68,167 U.S. census tracts.
Ventura, CA County Value
(15.5%)
The regional value is compared to the Ventura County value.
US Value
(15.5%)
The regional value is compared to the national value.
Adults who Binge Drink: Last 30 Days Census Tract: 06111007506
Adults who Binge Drink: Last 30 Days Census Tract: 06111007506
17.8%
(2021)
Compared to:
CA Census Tracts
The distribution is based on data from 8,005 California census tracts.
U.S. Census Tracts
The distribution is based on data from 68,167 U.S. census tracts.
Ventura, CA County Value
(15.5%)
The regional value is compared to the Ventura County value.
US Value
(15.5%)
The regional value is compared to the national value.
Adults who Binge Drink: Last 30 Days Census Tract: 06111007507
Adults who Binge Drink: Last 30 Days Census Tract: 06111007507
17.6%
(2021)
Compared to:
CA Census Tracts
The distribution is based on data from 8,005 California census tracts.
U.S. Census Tracts
The distribution is based on data from 68,167 U.S. census tracts.
Ventura, CA County Value
(15.5%)
The regional value is compared to the Ventura County value.
US Value
(15.5%)
The regional value is compared to the national value.
Adults who Binge Drink: Last 30 Days Census Tract: 06111007508
Adults who Binge Drink: Last 30 Days Census Tract: 06111007508
17.1%
(2021)
Compared to:
CA Census Tracts
The distribution is based on data from 8,005 California census tracts.
U.S. Census Tracts
The distribution is based on data from 68,167 U.S. census tracts.
Ventura, CA County Value
(15.5%)
The regional value is compared to the Ventura County value.
US Value
(15.5%)
The regional value is compared to the national value.
Adults who Binge Drink: Last 30 Days Census Tract: 06111007509
Adults who Binge Drink: Last 30 Days Census Tract: 06111007509
17.5%
(2021)
Compared to:
CA Census Tracts
The distribution is based on data from 8,005 California census tracts.
U.S. Census Tracts
The distribution is based on data from 68,167 U.S. census tracts.
Ventura, CA County Value
(15.5%)
The regional value is compared to the Ventura County value.
US Value
(15.5%)
The regional value is compared to the national value.
Adults who Binge Drink: Last 30 Days Census Tract: 06111007510
Adults who Binge Drink: Last 30 Days Census Tract: 06111007510
16.8%
(2021)
Compared to:
CA Census Tracts
The distribution is based on data from 8,005 California census tracts.
U.S. Census Tracts
The distribution is based on data from 68,167 U.S. census tracts.
Ventura, CA County Value
(15.5%)
The regional value is compared to the Ventura County value.
US Value
(15.5%)
The regional value is compared to the national value.
Adults who Binge Drink: Last 30 Days Census Tract: 06111007511
Adults who Binge Drink: Last 30 Days Census Tract: 06111007511
16.2%
(2021)
Compared to:
CA Census Tracts
The distribution is based on data from 8,005 California census tracts.
U.S. Census Tracts
The distribution is based on data from 68,167 U.S. census tracts.
Ventura, CA County Value
(15.5%)
The regional value is compared to the Ventura County value.
US Value
(15.5%)
The regional value is compared to the national value.
Adults who Binge Drink: Last 30 Days Census Tract: 06111007512
Adults who Binge Drink: Last 30 Days Census Tract: 06111007512
18.4%
(2021)
Compared to:
CA Census Tracts
The distribution is based on data from 8,005 California census tracts.
U.S. Census Tracts
The distribution is based on data from 68,167 U.S. census tracts.
Ventura, CA County Value
(15.5%)
The regional value is compared to the Ventura County value.
US Value
(15.5%)
The regional value is compared to the national value.
Adults who Binge Drink: Last 30 Days Census Tract: 06111007513
Adults who Binge Drink: Last 30 Days Census Tract: 06111007513
17.2%
(2021)
Compared to:
CA Census Tracts
The distribution is based on data from 8,005 California census tracts.
U.S. Census Tracts
The distribution is based on data from 68,167 U.S. census tracts.
Ventura, CA County Value
(15.5%)
The regional value is compared to the Ventura County value.
US Value
(15.5%)
The regional value is compared to the national value.
Adults who Binge Drink: Last 30 Days Census Tract: 06111007514
Adults who Binge Drink: Last 30 Days Census Tract: 06111007514
17.1%
(2021)
Compared to:
CA Census Tracts
The distribution is based on data from 8,005 California census tracts.
U.S. Census Tracts
The distribution is based on data from 68,167 U.S. census tracts.
Ventura, CA County Value
(15.5%)
The regional value is compared to the Ventura County value.
US Value
(15.5%)
The regional value is compared to the national value.
Adults who Binge Drink: Last 30 Days Census Tract: 06111007606
Adults who Binge Drink: Last 30 Days Census Tract: 06111007606
17.6%
(2021)
Compared to:
CA Census Tracts
The distribution is based on data from 8,005 California census tracts.
U.S. Census Tracts
The distribution is based on data from 68,167 U.S. census tracts.
Ventura, CA County Value
(15.5%)
The regional value is compared to the Ventura County value.
US Value
(15.5%)
The regional value is compared to the national value.
Adults who Binge Drink: Last 30 Days Census Tract: 06111007607
Adults who Binge Drink: Last 30 Days Census Tract: 06111007607
18.4%
(2021)
Compared to:
CA Census Tracts
The distribution is based on data from 8,005 California census tracts.
U.S. Census Tracts
The distribution is based on data from 68,167 U.S. census tracts.
Ventura, CA County Value
(15.5%)
The regional value is compared to the Ventura County value.
US Value
(15.5%)
The regional value is compared to the national value.
Adults who Binge Drink: Last 30 Days Census Tract: 06111007609
Adults who Binge Drink: Last 30 Days Census Tract: 06111007609
18.6%
(2021)
Compared to:
CA Census Tracts
The distribution is based on data from 8,005 California census tracts.
U.S. Census Tracts
The distribution is based on data from 68,167 U.S. census tracts.
Ventura, CA County Value
(15.5%)
The regional value is compared to the Ventura County value.
US Value
(15.5%)
The regional value is compared to the national value.
Adults who Binge Drink: Last 30 Days Census Tract: 06111007610
Adults who Binge Drink: Last 30 Days Census Tract: 06111007610
18.5%
(2021)
Compared to:
CA Census Tracts
The distribution is based on data from 8,005 California census tracts.
U.S. Census Tracts
The distribution is based on data from 68,167 U.S. census tracts.
Ventura, CA County Value
(15.5%)
The regional value is compared to the Ventura County value.
US Value
(15.5%)
The regional value is compared to the national value.
Adults who Binge Drink: Last 30 Days Census Tract: 06111007611
Adults who Binge Drink: Last 30 Days Census Tract: 06111007611
18.4%
(2021)
Compared to:
CA Census Tracts
The distribution is based on data from 8,005 California census tracts.
U.S. Census Tracts
The distribution is based on data from 68,167 U.S. census tracts.
Ventura, CA County Value
(15.5%)
The regional value is compared to the Ventura County value.
US Value
(15.5%)
The regional value is compared to the national value.
Adults who Binge Drink: Last 30 Days Census Tract: 06111007612
Adults who Binge Drink: Last 30 Days Census Tract: 06111007612
18.7%
(2021)
Compared to:
CA Census Tracts
The distribution is based on data from 8,005 California census tracts.
U.S. Census Tracts
The distribution is based on data from 68,167 U.S. census tracts.
Ventura, CA County Value
(15.5%)
The regional value is compared to the Ventura County value.
US Value
(15.5%)
The regional value is compared to the national value.
Adults who Binge Drink: Last 30 Days Census Tract: 06111007613
Adults who Binge Drink: Last 30 Days Census Tract: 06111007613
18.6%
(2021)
Compared to:
CA Census Tracts
The distribution is based on data from 8,005 California census tracts.
U.S. Census Tracts
The distribution is based on data from 68,167 U.S. census tracts.
Ventura, CA County Value
(15.5%)
The regional value is compared to the Ventura County value.
US Value
(15.5%)
The regional value is compared to the national value.
Adults who Binge Drink: Last 30 Days Census Tract: 06111007614
Adults who Binge Drink: Last 30 Days Census Tract: 06111007614
18.2%
(2021)
Compared to:
CA Census Tracts
The distribution is based on data from 8,005 California census tracts.
U.S. Census Tracts
The distribution is based on data from 68,167 U.S. census tracts.
Ventura, CA County Value
(15.5%)
The regional value is compared to the Ventura County value.
US Value
(15.5%)
The regional value is compared to the national value.
Adults who Binge Drink: Last 30 Days Census Tract: 06111007700
Adults who Binge Drink: Last 30 Days Census Tract: 06111007700
17.8%
(2021)
Compared to:
CA Census Tracts
The distribution is based on data from 8,005 California census tracts.
U.S. Census Tracts
The distribution is based on data from 68,167 U.S. census tracts.
Ventura, CA County Value
(15.5%)
The regional value is compared to the Ventura County value.
US Value
(15.5%)
The regional value is compared to the national value.
Adults who Binge Drink: Last 30 Days Census Tract: 06111007800
Adults who Binge Drink: Last 30 Days Census Tract: 06111007800
17.0%
(2021)
Compared to:
CA Census Tracts
The distribution is based on data from 8,005 California census tracts.
U.S. Census Tracts
The distribution is based on data from 68,167 U.S. census tracts.
Ventura, CA County Value
(15.5%)
The regional value is compared to the Ventura County value.
US Value
(15.5%)
The regional value is compared to the national value.
Adults who Binge Drink: Last 30 Days Census Tract: 06111007901
Adults who Binge Drink: Last 30 Days Census Tract: 06111007901
18.5%
(2021)
Compared to:
CA Census Tracts
The distribution is based on data from 8,005 California census tracts.
U.S. Census Tracts
The distribution is based on data from 68,167 U.S. census tracts.
Ventura, CA County Value
(15.5%)
The regional value is compared to the Ventura County value.
US Value
(15.5%)
The regional value is compared to the national value.
Adults who Binge Drink: Last 30 Days Census Tract: 06111007903
Adults who Binge Drink: Last 30 Days Census Tract: 06111007903
17.3%
(2021)
Compared to:
CA Census Tracts
The distribution is based on data from 8,005 California census tracts.
U.S. Census Tracts
The distribution is based on data from 68,167 U.S. census tracts.
Ventura, CA County Value
(15.5%)
The regional value is compared to the Ventura County value.
US Value
(15.5%)
The regional value is compared to the national value.
Adults who Binge Drink: Last 30 Days Census Tract: 06111007904
Adults who Binge Drink: Last 30 Days Census Tract: 06111007904
18.0%
(2021)
Compared to:
CA Census Tracts
The distribution is based on data from 8,005 California census tracts.
U.S. Census Tracts
The distribution is based on data from 68,167 U.S. census tracts.
Ventura, CA County Value
(15.5%)
The regional value is compared to the Ventura County value.
US Value
(15.5%)
The regional value is compared to the national value.
Adults who Binge Drink: Last 30 Days Census Tract: 06111008001
Adults who Binge Drink: Last 30 Days Census Tract: 06111008001
17.5%
(2021)
Compared to:
CA Census Tracts
The distribution is based on data from 8,005 California census tracts.
U.S. Census Tracts
The distribution is based on data from 68,167 U.S. census tracts.
Ventura, CA County Value
(15.5%)
The regional value is compared to the Ventura County value.
US Value
(15.5%)
The regional value is compared to the national value.
Adults who Binge Drink: Last 30 Days Census Tract: 06111008002
Adults who Binge Drink: Last 30 Days Census Tract: 06111008002
17.7%
(2021)
Compared to:
CA Census Tracts
The distribution is based on data from 8,005 California census tracts.
U.S. Census Tracts
The distribution is based on data from 68,167 U.S. census tracts.
Ventura, CA County Value
(15.5%)
The regional value is compared to the Ventura County value.
US Value
(15.5%)
The regional value is compared to the national value.
Adults who Binge Drink: Last 30 Days Census Tract: 06111008004
Adults who Binge Drink: Last 30 Days Census Tract: 06111008004
18.0%
(2021)
Compared to:
CA Census Tracts
The distribution is based on data from 8,005 California census tracts.
U.S. Census Tracts
The distribution is based on data from 68,167 U.S. census tracts.
Ventura, CA County Value
(15.5%)
The regional value is compared to the Ventura County value.
US Value
(15.5%)
The regional value is compared to the national value.
Adults who Binge Drink: Last 30 Days Census Tract: 06111008005
Adults who Binge Drink: Last 30 Days Census Tract: 06111008005
18.6%
(2021)
Compared to:
CA Census Tracts
The distribution is based on data from 8,005 California census tracts.
U.S. Census Tracts
The distribution is based on data from 68,167 U.S. census tracts.
Ventura, CA County Value
(15.5%)
The regional value is compared to the Ventura County value.
US Value
(15.5%)
The regional value is compared to the national value.
Adults who Binge Drink: Last 30 Days Census Tract: 06111008101
Adults who Binge Drink: Last 30 Days Census Tract: 06111008101
17.2%
(2021)
Compared to:
CA Census Tracts
The distribution is based on data from 8,005 California census tracts.
U.S. Census Tracts
The distribution is based on data from 68,167 U.S. census tracts.
Ventura, CA County Value
(15.5%)
The regional value is compared to the Ventura County value.
US Value
(15.5%)
The regional value is compared to the national value.
Adults who Binge Drink: Last 30 Days Census Tract: 06111008201
Adults who Binge Drink: Last 30 Days Census Tract: 06111008201
17.5%
(2021)
Compared to:
CA Census Tracts
The distribution is based on data from 8,005 California census tracts.
U.S. Census Tracts
The distribution is based on data from 68,167 U.S. census tracts.
Ventura, CA County Value
(15.5%)
The regional value is compared to the Ventura County value.
US Value
(15.5%)
The regional value is compared to the national value.
Adults who Binge Drink: Last 30 Days Census Tract: 06111008202
Adults who Binge Drink: Last 30 Days Census Tract: 06111008202
17.4%
(2021)
Compared to:
CA Census Tracts
The distribution is based on data from 8,005 California census tracts.
U.S. Census Tracts
The distribution is based on data from 68,167 U.S. census tracts.
Ventura, CA County Value
(15.5%)
The regional value is compared to the Ventura County value.
US Value
(15.5%)
The regional value is compared to the national value.
Adults who Binge Drink: Last 30 Days Census Tract: 06111008302
Adults who Binge Drink: Last 30 Days Census Tract: 06111008302
16.6%
(2021)
Compared to:
CA Census Tracts
The distribution is based on data from 8,005 California census tracts.
U.S. Census Tracts
The distribution is based on data from 68,167 U.S. census tracts.
Ventura, CA County Value
(15.5%)
The regional value is compared to the Ventura County value.
US Value
(15.5%)
The regional value is compared to the national value.
Adults who Binge Drink: Last 30 Days Census Tract: 06111008303
Adults who Binge Drink: Last 30 Days Census Tract: 06111008303
16.4%
(2021)
Compared to:
CA Census Tracts
The distribution is based on data from 8,005 California census tracts.
U.S. Census Tracts
The distribution is based on data from 68,167 U.S. census tracts.
Ventura, CA County Value
(15.5%)
The regional value is compared to the Ventura County value.
US Value
(15.5%)
The regional value is compared to the national value.
Adults who Binge Drink: Last 30 Days Census Tract: 06111008304
Adults who Binge Drink: Last 30 Days Census Tract: 06111008304
17.2%
(2021)
Compared to:
CA Census Tracts
The distribution is based on data from 8,005 California census tracts.
U.S. Census Tracts
The distribution is based on data from 68,167 U.S. census tracts.
Ventura, CA County Value
(15.5%)
The regional value is compared to the Ventura County value.
US Value
(15.5%)
The regional value is compared to the national value.
Adults who Binge Drink: Last 30 Days Census Tract: 06111008305
Adults who Binge Drink: Last 30 Days Census Tract: 06111008305
17.0%
(2021)
Compared to:
CA Census Tracts
The distribution is based on data from 8,005 California census tracts.
U.S. Census Tracts
The distribution is based on data from 68,167 U.S. census tracts.
Ventura, CA County Value
(15.5%)
The regional value is compared to the Ventura County value.
US Value
(15.5%)
The regional value is compared to the national value.
Adults who Binge Drink: Last 30 Days Census Tract: 06111008306
Adults who Binge Drink: Last 30 Days Census Tract: 06111008306
18.0%
(2021)
Compared to:
CA Census Tracts
The distribution is based on data from 8,005 California census tracts.
U.S. Census Tracts
The distribution is based on data from 68,167 U.S. census tracts.
Ventura, CA County Value
(15.5%)
The regional value is compared to the Ventura County value.
US Value
(15.5%)
The regional value is compared to the national value.
Adults who Binge Drink: Last 30 Days Census Tract: 06111008401
Adults who Binge Drink: Last 30 Days Census Tract: 06111008401
17.0%
(2021)
Compared to:
CA Census Tracts
The distribution is based on data from 8,005 California census tracts.
U.S. Census Tracts
The distribution is based on data from 68,167 U.S. census tracts.
Ventura, CA County Value
(15.5%)
The regional value is compared to the Ventura County value.
US Value
(15.5%)
The regional value is compared to the national value.
Adults who Binge Drink: Last 30 Days Census Tract: 06111008402
Adults who Binge Drink: Last 30 Days Census Tract: 06111008402
17.3%
(2021)
Compared to:
CA Census Tracts
The distribution is based on data from 8,005 California census tracts.
U.S. Census Tracts
The distribution is based on data from 68,167 U.S. census tracts.
Ventura, CA County Value
(15.5%)
The regional value is compared to the Ventura County value.
US Value
(15.5%)
The regional value is compared to the national value.
Adults who Binge Drink: Last 30 Days Census Tract: 06111008500
Adults who Binge Drink: Last 30 Days Census Tract: 06111008500
17.5%
(2021)
Compared to:
CA Census Tracts
The distribution is based on data from 8,005 California census tracts.
U.S. Census Tracts
The distribution is based on data from 68,167 U.S. census tracts.
Ventura, CA County Value
(15.5%)
The regional value is compared to the Ventura County value.
US Value
(15.5%)
The regional value is compared to the national value.
Adults who Binge Drink: Last 30 Days Census Tract: 06111008600
Adults who Binge Drink: Last 30 Days Census Tract: 06111008600
16.0%
(2021)
Compared to:
CA Census Tracts
The distribution is based on data from 8,005 California census tracts.
U.S. Census Tracts
The distribution is based on data from 68,167 U.S. census tracts.
Ventura, CA County Value
(15.5%)
The regional value is compared to the Ventura County value.
US Value
(15.5%)
The regional value is compared to the national value.
Adults who Binge Drink: Last 30 Days Census Tract: 06111008700
Adults who Binge Drink: Last 30 Days Census Tract: 06111008700
15.6%
(2021)
Compared to:
CA Census Tracts
The distribution is based on data from 8,005 California census tracts.
U.S. Census Tracts
The distribution is based on data from 68,167 U.S. census tracts.
Ventura, CA County Value
(15.5%)
The regional value is compared to the Ventura County value.
US Value
(15.5%)
The regional value is compared to the national value.
Adults who Binge Drink: Last 30 Days Census Tract: 06111008800
Adults who Binge Drink: Last 30 Days Census Tract: 06111008800
17.0%
(2021)
Compared to:
CA Census Tracts
The distribution is based on data from 8,005 California census tracts.
U.S. Census Tracts
The distribution is based on data from 68,167 U.S. census tracts.
Ventura, CA County Value
(15.5%)
The regional value is compared to the Ventura County value.
US Value
(15.5%)
The regional value is compared to the national value.
Adults who Binge Drink: Last 30 Days Census Tract: 06111008900
Adults who Binge Drink: Last 30 Days Census Tract: 06111008900
17.0%
(2021)
Compared to:
CA Census Tracts
The distribution is based on data from 8,005 California census tracts.
U.S. Census Tracts
The distribution is based on data from 68,167 U.S. census tracts.
Ventura, CA County Value
(15.5%)
The regional value is compared to the Ventura County value.
US Value
(15.5%)
The regional value is compared to the national value.
Adults who Binge Drink: Last 30 Days Census Tract: 06111009100
Adults who Binge Drink: Last 30 Days Census Tract: 06111009100
13.6%
(2021)
Compared to:
CA Census Tracts
The distribution is based on data from 8,005 California census tracts.
U.S. Census Tracts
The distribution is based on data from 68,167 U.S. census tracts.
Ventura, CA County Value
(15.5%)
The regional value is compared to the Ventura County value.
US Value
(15.5%)
The regional value is compared to the national value.
Adults who Binge Drink: Last 30 Days Census Tract: 06111980000
Adults who Binge Drink: Last 30 Days Census Tract: 06111980000
29.7%
(2021)
Compared to:
CA Census Tracts
The distribution is based on data from 8,005 California census tracts.
U.S. Census Tracts
The distribution is based on data from 68,167 U.S. census tracts.
Ventura, CA County Value
(15.5%)
The regional value is compared to the Ventura County value.
US Value
(15.5%)
The regional value is compared to the national value.
Age-Adjusted Death Rate due to All Opioid Overdose County: Ventura
Age-Adjusted Death Rate due to All Opioid Overdose County: Ventura
24.4
Rate per 100,000 residents
(2022)
Compared to:

CA Counties
The distribution is based on data from 58 California counties.
CA Value
(18.7)
The regional value is compared to the California state value.
Prior Value
(26.1)
Prior Value compares a measured value with the previously measured value. Confidence intervals were not taken into account in determining the direction of the comparison.
Trend
This comparison measures the indicator’s values over multiple time periods.<br>The Mann-Kendall Test for Statistical Significance is used to evaluate the trend<br>over 4 to 10 periods of measure, subject to data availability and comparability.
Age-Adjusted Death Rate due to Drug Use County: Ventura
Age-Adjusted Death Rate due to Drug Use County: Ventura
23.5
Deaths per 100,000 population
(2019-2021)
Compared to:

CA Counties
The distribution is based on data from 57 California counties.
CA Value
(21.4)
The regional value is compared to the California state value.
Prior Value
(19.0)
Prior Value compares a measured value with the previously measured value. Confidence intervals were taken into account in determining the direction of the comparison.
Trend
This comparison measures the indicator’s values over multiple time periods.<br>The Mann-Kendall Test for Statistical Significance is used to evaluate the trend<br>over 4 to 10 periods of measure, subject to data availability and comparability.
Age-Adjusted Death Rate due to Fentanyl Overdose County: Ventura
Age-Adjusted Death Rate due to Fentanyl Overdose County: Ventura
21.7
(2022)
Compared to:
CA Counties
The distribution is based on data from 58 California counties.
CA Value
(16.6)
The regional value is compared to the California state value.
Prior Value
(21.1)
Prior Value compares a measured value with the previously measured value. Confidence intervals were not taken into account in determining the direction of the comparison.
Trend
This comparison measures the indicator’s values over multiple time periods.<br>The Mann-Kendall Test for Statistical Significance is used to evaluate the trend<br>over 4 to 10 periods of measure, subject to data availability and comparability.
Age-Adjusted Death Rate due to Heroin Overdose County: Ventura
Age-Adjusted Death Rate due to Heroin Overdose County: Ventura
1.1
Deaths per 100,000 population
(2022)
Compared to:

CA Counties
(2018)
The distribution is based on data from 58 California counties.
CA Value
(1.2)
The regional value is compared to the California state value.
Prior Value
(2.6)
Prior Value compares a measured value with the previously measured value. Confidence intervals were not taken into account in determining the direction of the comparison.
Trend
This comparison measures the indicator’s values over multiple time periods.<br>The Mann-Kendall Test for Statistical Significance is used to evaluate the trend<br>over 4 to 10 periods of measure, subject to data availability and comparability.
HP 2030 Target
(4.2)
Health / Alcohol & Drug Use
Age-Adjusted Death Rate due to Prescription Opioid Overdose
Value
Compared to:
Age-Adjusted Death Rate due to Prescription Opioid Overdose County: Ventura
Age-Adjusted Death Rate due to Prescription Opioid Overdose County: Ventura
24.3
Rate per 100,000 residents
(2022)
Compared to:
CA Counties
The distribution is based on data from 58 California counties.
CA Value
(18.1)
The regional value is compared to the California state value.
Prior Value
(24.7)
Prior Value compares a measured value with the previously measured value. Confidence intervals were not taken into account in determining the direction of the comparison.
Trend
This comparison measures the indicator’s values over multiple time periods.<br>The Mann-Kendall Test for Statistical Significance is used to evaluate the trend<br>over 4 to 10 periods of measure, subject to data availability and comparability.
Health / Alcohol & Drug Use
Age-Adjusted Death Rate due to Synthetic Opioid Overdose (excluding Methadone)
Value
Compared to:
Age-Adjusted Death Rate due to Synthetic Opioid Overdose (excluding Methadone) County: Ventura
Age-Adjusted Death Rate due to Synthetic Opioid Overdose (excluding Methadone) County: Ventura
21.8
Rate per 100,000 residents
(2022)
Compared to:
CA Counties
The distribution is based on data from 58 California counties.
CA Value
(16.7)
The regional value is compared to the California state value.
Prior Value
(21.9)
Prior Value compares a measured value with the previously measured value. Confidence intervals were not taken into account in determining the direction of the comparison.
Trend
This comparison measures the indicator’s values over multiple time periods.<br>The Mann-Kendall Test for Statistical Significance is used to evaluate the trend<br>over 4 to 10 periods of measure, subject to data availability and comparability.
HP 2030 Target
(8.9)
<div>IVP-22: Reduce overdose deaths involving synthetic opioids other than methadone</div>
Health / Alcohol & Drug Use
Age-Adjusted Drug and Opioid-Involved Overdose Death Rate
Value
Compared to:
Age-Adjusted Drug and Opioid-Involved Overdose Death Rate County: Ventura
Age-Adjusted Drug and Opioid-Involved Overdose Death Rate County: Ventura
17.9
Deaths per 100,000 population
(2018-2020)
Compared to:
CA Counties
The distribution is based on data from 48 California counties.
U.S. Counties
The distribution is based on data from 1,303 U.S. counties and county equivalents.
CA Value
(16.5)
The regional value is compared to the California state value.
US Value
(23.5)
The regional value is compared to the national value.
Prior Value
(17.6)
Prior Value compares a measured value with the previously measured value. Confidence intervals were taken into account in determining the direction of the comparison.
Age-Adjusted ED Visit Rate due to All Drug Overdose County: Ventura
Age-Adjusted ED Visit Rate due to All Drug Overdose County: Ventura
163.3
Rate per 100,000 residents
(2022)
Compared to:
CA Counties
The distribution is based on data from 58 California counties.
CA Value
(143.7)
The regional value is compared to the California state value.
Prior Value
(162.2)
Prior Value compares a measured value with the previously measured value. Confidence intervals were not taken into account in determining the direction of the comparison.
Trend
This comparison measures the indicator’s values over multiple time periods.<br>The Mann-Kendall Test for Statistical Significance is used to evaluate the trend<br>over 4 to 10 periods of measure, subject to data availability and comparability.
Age-Adjusted ED Visit Rate due to Heroin Overdose County: Ventura
Age-Adjusted ED Visit Rate due to Heroin Overdose County: Ventura
3.8
Rate per 100,000 residents
(2022)
Compared to:
CA Counties
The distribution is based on data from 58 California counties.
CA Value
(3.6)
The regional value is compared to the California state value.
Prior Value
(0.9)
Prior Value compares a measured value with the previously measured value. Confidence intervals were not taken into account in determining the direction of the comparison.
Trend
This comparison measures the indicator’s values over multiple time periods.<br>The Mann-Kendall Test for Statistical Significance is used to evaluate the trend<br>over 4 to 10 periods of measure, subject to data availability and comparability.
Health / Alcohol & Drug Use
Age-Adjusted ED Visit Rate due to Opioid Overdose (excluding Heroin)
Value
Compared to:
Age-Adjusted ED Visit Rate due to Opioid Overdose (excluding Heroin) County: Ventura
Age-Adjusted ED Visit Rate due to Opioid Overdose (excluding Heroin) County: Ventura
73.3
Rate per 100,000 residents
(2022)
Compared to:
CA Counties
The distribution is based on data from 58 California counties.
CA Value
(54.9)
The regional value is compared to the California state value.
Prior Value
(9.6)
Prior Value compares a measured value with the previously measured value. Confidence intervals were not taken into account in determining the direction of the comparison.
Trend
This comparison measures the indicator’s values over multiple time periods.<br>The Mann-Kendall Test for Statistical Significance is used to evaluate the trend<br>over 4 to 10 periods of measure, subject to data availability and comparability.
Age-Adjusted ER Rate due to Adolescent Alcohol Use County: Ventura
Age-Adjusted ER Rate due to Adolescent Alcohol Use County: Ventura
17.3
ER visits per 10,000 population aged 10-17
(2018-2020)
Compared to:
CA Counties
The distribution is based on data from 54 California counties.
CA Value
(9.7)
The regional value is compared to the California state value.
Prior Value
(19.0)
Prior Value compares a measured value with the previously measured value. Confidence intervals were taken into account in determining the direction of the comparison.
Age-Adjusted ER Rate due to Adolescent Alcohol Use Zip Code: 91320
Age-Adjusted ER Rate due to Adolescent Alcohol Use Zip Code: 91320
18.7
ER visits per 10,000 population aged 10-17
(2018-2020)
Compared to:
Ventura, CA County Value
(17.3)
The regional value is compared to the Ventura County value.
Prior Value
(19.1)
Prior Value compares a measured value with the previously measured value. Confidence intervals were taken into account in determining the direction of the comparison.
Age-Adjusted ER Rate due to Adolescent Alcohol Use Zip Code: 91360
Age-Adjusted ER Rate due to Adolescent Alcohol Use Zip Code: 91360
12.3
ER visits per 10,000 population aged 10-17
(2018-2020)
Compared to:
Ventura, CA County Value
(17.3)
The regional value is compared to the Ventura County value.
Prior Value
(16.5)
Prior Value compares a measured value with the previously measured value. Confidence intervals were taken into account in determining the direction of the comparison.
Age-Adjusted ER Rate due to Adolescent Alcohol Use Zip Code: 91361
Age-Adjusted ER Rate due to Adolescent Alcohol Use Zip Code: 91361
23.8
ER visits per 10,000 population aged 10-17
(2016-2018)
Compared to:
Ventura, CA County Value
(19.2)
The regional value is compared to the Ventura County value.
Age-Adjusted ER Rate due to Adolescent Alcohol Use Zip Code: 91362
Age-Adjusted ER Rate due to Adolescent Alcohol Use Zip Code: 91362
11.6
ER visits per 10,000 population aged 10-17
(2018-2020)
Compared to:
Ventura, CA County Value
(17.3)
The regional value is compared to the Ventura County value.
Prior Value
(10.5)
Prior Value compares a measured value with the previously measured value. Confidence intervals were taken into account in determining the direction of the comparison.
Age-Adjusted ER Rate due to Adolescent Alcohol Use Zip Code: 93001
Age-Adjusted ER Rate due to Adolescent Alcohol Use Zip Code: 93001
24.9
ER visits per 10,000 population aged 10-17
(2018-2020)
Compared to:
Ventura, CA County Value
(17.3)
The regional value is compared to the Ventura County value.
Prior Value
(31.1)
Prior Value compares a measured value with the previously measured value. Confidence intervals were taken into account in determining the direction of the comparison.
Age-Adjusted ER Rate due to Adolescent Alcohol Use Zip Code: 93003
Age-Adjusted ER Rate due to Adolescent Alcohol Use Zip Code: 93003
12.2
ER visits per 10,000 population aged 10-17
(2018-2020)
Compared to:
Ventura, CA County Value
(17.3)
The regional value is compared to the Ventura County value.
Prior Value
(17.3)
Prior Value compares a measured value with the previously measured value. Confidence intervals were taken into account in determining the direction of the comparison.
Age-Adjusted ER Rate due to Adolescent Alcohol Use Zip Code: 93004
Age-Adjusted ER Rate due to Adolescent Alcohol Use Zip Code: 93004
13.1
ER visits per 10,000 population aged 10-17
(2018-2020)
Compared to:
Ventura, CA County Value
(17.3)
The regional value is compared to the Ventura County value.
Prior Value
(13.0)
Prior Value compares a measured value with the previously measured value. Confidence intervals were taken into account in determining the direction of the comparison.
Age-Adjusted ER Rate due to Adolescent Alcohol Use Zip Code: 93010
Age-Adjusted ER Rate due to Adolescent Alcohol Use Zip Code: 93010
10.1
ER visits per 10,000 population aged 10-17
(2018-2020)
Compared to:
Ventura, CA County Value
(17.3)
The regional value is compared to the Ventura County value.
Prior Value
(14.9)
Prior Value compares a measured value with the previously measured value. Confidence intervals were taken into account in determining the direction of the comparison.
Age-Adjusted ER Rate due to Adolescent Alcohol Use Zip Code: 93012
Age-Adjusted ER Rate due to Adolescent Alcohol Use Zip Code: 93012
31.9
ER visits per 10,000 population aged 10-17
(2018-2020)
Compared to:
Ventura, CA County Value
(17.3)
The regional value is compared to the Ventura County value.
Prior Value
(28.1)
Prior Value compares a measured value with the previously measured value. Confidence intervals were taken into account in determining the direction of the comparison.
Age-Adjusted ER Rate due to Adolescent Alcohol Use Zip Code: 93015
Age-Adjusted ER Rate due to Adolescent Alcohol Use Zip Code: 93015
21.3
ER visits per 10,000 population aged 10-17
(2018-2020)
Compared to:
Ventura, CA County Value
(17.3)
The regional value is compared to the Ventura County value.
Prior Value
(21.2)
Prior Value compares a measured value with the previously measured value. Confidence intervals were taken into account in determining the direction of the comparison.
Age-Adjusted ER Rate due to Adolescent Alcohol Use Zip Code: 93021
Age-Adjusted ER Rate due to Adolescent Alcohol Use Zip Code: 93021
9.1
ER visits per 10,000 population aged 10-17
(2016-2018)
Compared to:
Ventura, CA County Value
(19.2)
The regional value is compared to the Ventura County value.
Age-Adjusted ER Rate due to Adolescent Alcohol Use Zip Code: 93023
Age-Adjusted ER Rate due to Adolescent Alcohol Use Zip Code: 93023
20.2
ER visits per 10,000 population aged 10-17
(2017-2019)
Compared to:
Ventura, CA County Value
(19.0)
The regional value is compared to the Ventura County value.
Prior Value
(26.5)
Prior Value compares a measured value with the previously measured value. Confidence intervals were taken into account in determining the direction of the comparison.
Age-Adjusted ER Rate due to Adolescent Alcohol Use Zip Code: 93030
Age-Adjusted ER Rate due to Adolescent Alcohol Use Zip Code: 93030
24.7
ER visits per 10,000 population aged 10-17
(2018-2020)
Compared to:
Ventura, CA County Value
(17.3)
The regional value is compared to the Ventura County value.
Prior Value
(24.5)
Prior Value compares a measured value with the previously measured value. Confidence intervals were taken into account in determining the direction of the comparison.
Age-Adjusted ER Rate due to Adolescent Alcohol Use Zip Code: 93033
Age-Adjusted ER Rate due to Adolescent Alcohol Use Zip Code: 93033
18.9
ER visits per 10,000 population aged 10-17
(2018-2020)
Compared to:
Ventura, CA County Value
(17.3)
The regional value is compared to the Ventura County value.
Prior Value
(20.1)
Prior Value compares a measured value with the previously measured value. Confidence intervals were taken into account in determining the direction of the comparison.
Age-Adjusted ER Rate due to Adolescent Alcohol Use Zip Code: 93035
Age-Adjusted ER Rate due to Adolescent Alcohol Use Zip Code: 93035
17.8
ER visits per 10,000 population aged 10-17
(2016-2018)
Compared to:
Ventura, CA County Value
(19.2)
The regional value is compared to the Ventura County value.
Age-Adjusted ER Rate due to Adolescent Alcohol Use Zip Code: 93036
Age-Adjusted ER Rate due to Adolescent Alcohol Use Zip Code: 93036
20.9
ER visits per 10,000 population aged 10-17
(2018-2020)
Compared to:
Ventura, CA County Value
(17.3)
The regional value is compared to the Ventura County value.
Prior Value
(18.8)
Prior Value compares a measured value with the previously measured value. Confidence intervals were taken into account in determining the direction of the comparison.
Age-Adjusted ER Rate due to Adolescent Alcohol Use Zip Code: 93041
Age-Adjusted ER Rate due to Adolescent Alcohol Use Zip Code: 93041
28.9
ER visits per 10,000 population aged 10-17
(2018-2020)
Compared to:
Ventura, CA County Value
(17.3)
The regional value is compared to the Ventura County value.
Prior Value
(26.6)
Prior Value compares a measured value with the previously measured value. Confidence intervals were taken into account in determining the direction of the comparison.
Age-Adjusted ER Rate due to Adolescent Alcohol Use Zip Code: 93060
Age-Adjusted ER Rate due to Adolescent Alcohol Use Zip Code: 93060
21.5
ER visits per 10,000 population aged 10-17
(2018-2020)
Compared to:
Ventura, CA County Value
(17.3)
The regional value is compared to the Ventura County value.
Prior Value
(24.7)
Prior Value compares a measured value with the previously measured value. Confidence intervals were taken into account in determining the direction of the comparison.
Age-Adjusted ER Rate due to Adolescent Alcohol Use Zip Code: 93063
Age-Adjusted ER Rate due to Adolescent Alcohol Use Zip Code: 93063
8.9
ER visits per 10,000 population aged 10-17
(2018-2020)
Compared to:
Ventura, CA County Value
(17.3)
The regional value is compared to the Ventura County value.
Prior Value
(10.8)
Prior Value compares a measured value with the previously measured value. Confidence intervals were taken into account in determining the direction of the comparison.
Age-Adjusted ER Rate due to Adolescent Alcohol Use Zip Code: 93065
Age-Adjusted ER Rate due to Adolescent Alcohol Use Zip Code: 93065
15.9
ER visits per 10,000 population aged 10-17
(2018-2020)
Compared to:
Ventura, CA County Value
(17.3)
The regional value is compared to the Ventura County value.
Prior Value
(19.2)
Prior Value compares a measured value with the previously measured value. Confidence intervals were taken into account in determining the direction of the comparison.
Age-Adjusted ER Rate due to Adult Alcohol Use County: Ventura
Age-Adjusted ER Rate due to Adult Alcohol Use County: Ventura
39.6
ER visits per 10,000 population 18+ years
(2018-2020)
Compared to:
CA Counties
The distribution is based on data from 57 California counties.
CA Value
(37.6)
The regional value is compared to the California state value.
Prior Value
(42.7)
Prior Value compares a measured value with the previously measured value. Confidence intervals were taken into account in determining the direction of the comparison.
Age-Adjusted ER Rate due to Adult Alcohol Use Zip Code: 91320
Age-Adjusted ER Rate due to Adult Alcohol Use Zip Code: 91320
21.2
ER visits per 10,000 population 18+ years
(2018-2020)
Compared to:
CA Zip Codes
The distribution is based on data from 1,324 California zip codes.
Ventura, CA County Value
(39.6)
The regional value is compared to the Ventura County value.
Prior Value
(23.2)
Prior Value compares a measured value with the previously measured value. Confidence intervals were taken into account in determining the direction of the comparison.
Age-Adjusted ER Rate due to Adult Alcohol Use Zip Code: 91360
Age-Adjusted ER Rate due to Adult Alcohol Use Zip Code: 91360
59.5
ER visits per 10,000 population 18+ years
(2018-2020)
Compared to:
CA Zip Codes
The distribution is based on data from 1,324 California zip codes.
Ventura, CA County Value
(39.6)
The regional value is compared to the Ventura County value.
Prior Value
(65.5)
Prior Value compares a measured value with the previously measured value. Confidence intervals were taken into account in determining the direction of the comparison.
Age-Adjusted ER Rate due to Adult Alcohol Use Zip Code: 91361
Age-Adjusted ER Rate due to Adult Alcohol Use Zip Code: 91361
25.0
ER visits per 10,000 population 18+ years
(2018-2020)
Compared to:
CA Zip Codes
The distribution is based on data from 1,324 California zip codes.
Ventura, CA County Value
(39.6)
The regional value is compared to the Ventura County value.
Prior Value
(31.1)
Prior Value compares a measured value with the previously measured value. Confidence intervals were taken into account in determining the direction of the comparison.
Age-Adjusted ER Rate due to Adult Alcohol Use Zip Code: 91362
Age-Adjusted ER Rate due to Adult Alcohol Use Zip Code: 91362
24.4
ER visits per 10,000 population 18+ years
(2018-2020)
Compared to:
CA Zip Codes
The distribution is based on data from 1,324 California zip codes.
Ventura, CA County Value
(39.6)
The regional value is compared to the Ventura County value.
Prior Value
(29.0)
Prior Value compares a measured value with the previously measured value. Confidence intervals were taken into account in determining the direction of the comparison.
Age-Adjusted ER Rate due to Adult Alcohol Use Zip Code: 91377
Age-Adjusted ER Rate due to Adult Alcohol Use Zip Code: 91377
12.3
ER visits per 10,000 population 18+ years
(2018-2020)
Compared to:
CA Zip Codes
The distribution is based on data from 1,324 California zip codes.
Ventura, CA County Value
(39.6)
The regional value is compared to the Ventura County value.
Prior Value
(10.4)
Prior Value compares a measured value with the previously measured value. Confidence intervals were taken into account in determining the direction of the comparison.
Age-Adjusted ER Rate due to Adult Alcohol Use Zip Code: 93001
Age-Adjusted ER Rate due to Adult Alcohol Use Zip Code: 93001
60.6
ER visits per 10,000 population 18+ years
(2018-2020)
Compared to:
CA Zip Codes
The distribution is based on data from 1,324 California zip codes.
Ventura, CA County Value
(39.6)
The regional value is compared to the Ventura County value.
Prior Value
(71.2)
Prior Value compares a measured value with the previously measured value. Confidence intervals were taken into account in determining the direction of the comparison.
