
Search for Indicators
Advancing Equitable Access to Healthcare
This is a priority based on the 2022-2024 Community Health Needs Assessment.
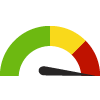
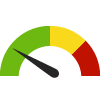
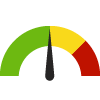
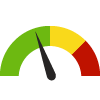
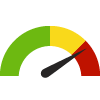
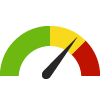
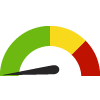
Indicator Gauge Icon Legend
Legend Colors
Red is bad, green is good, blue is not statistically different/neutral.
Compared to Distribution
 the value is in the best half of communities.
 the value is in the 2nd worst quarter of communities.
 the value is in the worst quarter of communities.
Compared to Target
 meets target;
  does not meet target.
Compared to a Single Value
 lower than the comparison value;
 higher than the comparison value;
 not statistically different from comparison value.
Trend

 non-significant change over time;
 significant change over time;
  no change over time.
Compared to Prior Value
 higher than the previous measurement period;
 lower than the previous measurement period;
 no statistically different change from previous measurement period.
 Significantly better than the overall value
 Significantly worse than the overall value
 Significantly different than the overall value
 No significant difference with the overall value
 No data on significance available
Health / Health Care Access & Quality
Health / Health Care Access & Quality
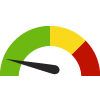
Adults Who Access Medical Services and Information through the Internet
Value
Compared to:
Adults Who Access Medical Services and Information through the Internet Census Tract: 06111008306
Adults Who Access Medical Services and Information through the Internet Census Tract: 06111008306
34.5%
(2022)
Compared to:


Ventura, CA County Value
(35.7%)
The regional value is compared to the Ventura County value.
Prior Value
(21.1%)
Prior Value compares a measured value with the previously measured value. Confidence intervals were not taken into account in determining the direction of the comparison.
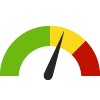
Adults Who Access Medical Services and Information through the Internet Census Tract: 06111008307
Adults Who Access Medical Services and Information through the Internet Census Tract: 06111008307
34.3%
(2023)
Compared to:
Ventura, CA County Value
(36.3%)
The regional value is compared to the Ventura County value.
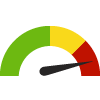
Adults Who Access Medical Services and Information through the Internet Census Tract: 06111008308
Adults Who Access Medical Services and Information through the Internet Census Tract: 06111008308
47.6%
(2023)
Compared to:

Ventura, CA County Value
(36.3%)
The regional value is compared to the Ventura County value.
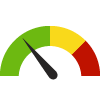
Adults Who Access Medical Services and Information through the Internet Census Tract: 06111008401
Adults Who Access Medical Services and Information through the Internet Census Tract: 06111008401
36.9%
(2023)
Compared to:
Ventura, CA County Value
(36.3%)
The regional value is compared to the Ventura County value.
Prior Value
(35.5%)
Prior Value compares a measured value with the previously measured value. Confidence intervals were not taken into account in determining the direction of the comparison.
Adults Who Access Medical Services and Information through the Internet Census Tract: 06111008402
Adults Who Access Medical Services and Information through the Internet Census Tract: 06111008402
42.9%
(2023)
Compared to:
Ventura, CA County Value
(36.3%)
The regional value is compared to the Ventura County value.
Prior Value
(38.1%)
Prior Value compares a measured value with the previously measured value. Confidence intervals were not taken into account in determining the direction of the comparison.
Adults Who Access Medical Services and Information through the Internet Census Tract: 06111008500
Adults Who Access Medical Services and Information through the Internet Census Tract: 06111008500
36.9%
(2022)
Compared to:
Ventura, CA County Value
(35.7%)
The regional value is compared to the Ventura County value.
Prior Value
(21.6%)
Prior Value compares a measured value with the previously measured value. Confidence intervals were not taken into account in determining the direction of the comparison.
Adults Who Access Medical Services and Information through the Internet Census Tract: 06111008501
Adults Who Access Medical Services and Information through the Internet Census Tract: 06111008501
46.4%
(2023)
Compared to:
Ventura, CA County Value
(36.3%)
The regional value is compared to the Ventura County value.
Adults Who Access Medical Services and Information through the Internet Census Tract: 06111008502
Adults Who Access Medical Services and Information through the Internet Census Tract: 06111008502
35.7%
(2023)
Compared to:
Ventura, CA County Value
(36.3%)
The regional value is compared to the Ventura County value.
Adults Who Access Medical Services and Information through the Internet Census Tract: 06111008600
Adults Who Access Medical Services and Information through the Internet Census Tract: 06111008600
32.6%
(2022)
Compared to:
Ventura, CA County Value
(35.7%)
The regional value is compared to the Ventura County value.
Prior Value
(21.1%)
Prior Value compares a measured value with the previously measured value. Confidence intervals were not taken into account in determining the direction of the comparison.
Adults Who Access Medical Services and Information through the Internet Census Tract: 06111008601
Adults Who Access Medical Services and Information through the Internet Census Tract: 06111008601
28.3%
(2023)
Compared to:
Ventura, CA County Value
(36.3%)
The regional value is compared to the Ventura County value.
Adults Who Access Medical Services and Information through the Internet Census Tract: 06111008602
Adults Who Access Medical Services and Information through the Internet Census Tract: 06111008602
23.4%
(2023)
Compared to:
Ventura, CA County Value
(36.3%)
The regional value is compared to the Ventura County value.
Adults Who Access Medical Services and Information through the Internet Census Tract: 06111008700
Adults Who Access Medical Services and Information through the Internet Census Tract: 06111008700
26.0%
(2023)
Compared to:

Ventura, CA County Value
(36.3%)
The regional value is compared to the Ventura County value.
Prior Value
(32.8%)
Prior Value compares a measured value with the previously measured value. Confidence intervals were not taken into account in determining the direction of the comparison.
Adults Who Access Medical Services and Information through the Internet Census Tract: 06111008800
Adults Who Access Medical Services and Information through the Internet Census Tract: 06111008800
30.7%
(2023)
Compared to:
Ventura, CA County Value
(36.3%)
The regional value is compared to the Ventura County value.
Prior Value
(34.2%)
Prior Value compares a measured value with the previously measured value. Confidence intervals were not taken into account in determining the direction of the comparison.
Adults Who Access Medical Services and Information through the Internet Census Tract: 06111008900
Adults Who Access Medical Services and Information through the Internet Census Tract: 06111008900
27.5%
(2023)
Compared to:
Ventura, CA County Value
(36.3%)
The regional value is compared to the Ventura County value.
Prior Value
(33.7%)
Prior Value compares a measured value with the previously measured value. Confidence intervals were not taken into account in determining the direction of the comparison.
Adults Who Access Medical Services and Information through the Internet Census Tract: 06111009100
Adults Who Access Medical Services and Information through the Internet Census Tract: 06111009100
27.5%
(2023)
Compared to:
Ventura, CA County Value
(36.3%)
The regional value is compared to the Ventura County value.
Prior Value
(33.4%)
Prior Value compares a measured value with the previously measured value. Confidence intervals were not taken into account in determining the direction of the comparison.
Adults Who Access Medical Services and Information through the Internet Census Tract: 06111009200
Adults Who Access Medical Services and Information through the Internet Census Tract: 06111009200
29.5%
(2023)
Compared to:
Ventura, CA County Value
(36.3%)
The regional value is compared to the Ventura County value.
Adults Who Access Medical Services and Information through the Internet Census Tract: 06111009300
Adults Who Access Medical Services and Information through the Internet Census Tract: 06111009300
38.5%
(2023)
Compared to:
Ventura, CA County Value
(36.3%)
The regional value is compared to the Ventura County value.
Adults Who Access Medical Services and Information through the Internet Census Tract: 06111009400
Adults Who Access Medical Services and Information through the Internet Census Tract: 06111009400
34.1%
(2023)
Compared to:
Ventura, CA County Value
(36.3%)
The regional value is compared to the Ventura County value.
Adults Who Access Medical Services and Information through the Internet Census Tract: 06111009500
Adults Who Access Medical Services and Information through the Internet Census Tract: 06111009500
37.7%
(2023)
Compared to:
Ventura, CA County Value
(36.3%)
The regional value is compared to the Ventura County value.
Adults Who Access Medical Services and Information through the Internet Census Tract: 06111009600
Adults Who Access Medical Services and Information through the Internet Census Tract: 06111009600
52.2%
(2023)
Compared to:
Ventura, CA County Value
(36.3%)
The regional value is compared to the Ventura County value.
Adults Who Access Medical Services and Information through the Internet Census Tract: 06111009700
Adults Who Access Medical Services and Information through the Internet Census Tract: 06111009700
28.7%
(2023)
Compared to:
Ventura, CA County Value
(36.3%)
The regional value is compared to the Ventura County value.
Adults Who Access Medical Services and Information through the Internet Census Tract: 06111980000
Adults Who Access Medical Services and Information through the Internet Census Tract: 06111980000
0.0%
(2023)
Compared to:
Ventura, CA County Value
(36.3%)
The regional value is compared to the Ventura County value.
Prior Value
(0.0%)
Prior Value compares a measured value with the previously measured value. Confidence intervals were not taken into account in determining the direction of the comparison.
Adults who have had a Routine Checkup County: Ventura
Adults who have had a Routine Checkup County: Ventura
64.4%
(2021)
Compared to:

CA Counties
The distribution is based on data from 58 California counties.
U.S. Counties
The distribution is based on data from 3,074 U.S. counties and county equivalents.
US Value
(73.6%)
The regional value is compared to the national value.
Adults who have had a Routine Checkup Census Place (City): Bell Canyon
Adults who have had a Routine Checkup Census Place (City): Bell Canyon
66.7%
(2021)
Compared to:
CA Census Places
The distribution is based on data from 1,472 locales.
U.S. Census Places
The distribution is based on data from 27,528 U.S. Census Places.
Ventura, CA County Value
(64.4%)
The regional value is compared to the Ventura County value.
US Value
(73.6%)
The regional value is compared to the national value.
Adults who have had a Routine Checkup Census Place (City): Camarillo
Adults who have had a Routine Checkup Census Place (City): Camarillo
65.5%
(2021)
Compared to:
CA Census Places
The distribution is based on data from 1,472 locales.
U.S. Census Places
The distribution is based on data from 27,528 U.S. Census Places.
Ventura, CA County Value
(64.4%)
The regional value is compared to the Ventura County value.
US Value
(73.6%)
The regional value is compared to the national value.
Adults who have had a Routine Checkup Census Place (City): Casa Conejo
Adults who have had a Routine Checkup Census Place (City): Casa Conejo
63.0%
(2021)
Compared to:
CA Census Places
The distribution is based on data from 1,472 locales.
U.S. Census Places
The distribution is based on data from 27,528 U.S. Census Places.
Ventura, CA County Value
(64.4%)
The regional value is compared to the Ventura County value.
US Value
(73.6%)
The regional value is compared to the national value.
Adults who have had a Routine Checkup Census Place (City): Channel Islands Beach
Adults who have had a Routine Checkup Census Place (City): Channel Islands Beach
64.3%
(2021)
Compared to:
CA Census Places
The distribution is based on data from 1,472 locales.
U.S. Census Places
The distribution is based on data from 27,528 U.S. Census Places.
Ventura, CA County Value
(64.4%)
The regional value is compared to the Ventura County value.
US Value
(73.6%)
The regional value is compared to the national value.
Adults who have had a Routine Checkup Census Place (City): El Rio
Adults who have had a Routine Checkup Census Place (City): El Rio
59.1%
(2021)
Compared to:
CA Census Places
The distribution is based on data from 1,472 locales.
U.S. Census Places
The distribution is based on data from 27,528 U.S. Census Places.
Ventura, CA County Value
(64.4%)
The regional value is compared to the Ventura County value.
US Value
(73.6%)
The regional value is compared to the national value.
Adults who have had a Routine Checkup Census Place (City): Fillmore
Adults who have had a Routine Checkup Census Place (City): Fillmore
61.1%
(2021)
Compared to:
CA Census Places
The distribution is based on data from 1,472 locales.
U.S. Census Places
The distribution is based on data from 27,528 U.S. Census Places.
Ventura, CA County Value
(64.4%)
The regional value is compared to the Ventura County value.
US Value
(73.6%)
The regional value is compared to the national value.
Adults who have had a Routine Checkup Census Place (City): Lake Sherwood
Adults who have had a Routine Checkup Census Place (City): Lake Sherwood
68.2%
(2021)
Compared to:
CA Census Places
The distribution is based on data from 1,472 locales.
U.S. Census Places
The distribution is based on data from 27,528 U.S. Census Places.
Ventura, CA County Value
(64.4%)
The regional value is compared to the Ventura County value.
US Value
(73.6%)
The regional value is compared to the national value.
Adults who have had a Routine Checkup Census Place (City): Meiners Oaks
Adults who have had a Routine Checkup Census Place (City): Meiners Oaks
64.0%
(2021)
Compared to:
CA Census Places
The distribution is based on data from 1,472 locales.
U.S. Census Places
The distribution is based on data from 27,528 U.S. Census Places.
Ventura, CA County Value
(64.4%)
The regional value is compared to the Ventura County value.
US Value
(73.6%)
The regional value is compared to the national value.
Adults who have had a Routine Checkup Census Place (City): Mira Monte
Adults who have had a Routine Checkup Census Place (City): Mira Monte
67.2%
(2021)
Compared to:
CA Census Places
The distribution is based on data from 1,472 locales.
U.S. Census Places
The distribution is based on data from 27,528 U.S. Census Places.
Ventura, CA County Value
(64.4%)
The regional value is compared to the Ventura County value.
US Value
(73.6%)
The regional value is compared to the national value.
Adults who have had a Routine Checkup Census Place (City): Moorpark
Adults who have had a Routine Checkup Census Place (City): Moorpark
61.8%
(2021)
Compared to:
CA Census Places
The distribution is based on data from 1,472 locales.
U.S. Census Places
The distribution is based on data from 27,528 U.S. Census Places.
Ventura, CA County Value
(64.4%)
The regional value is compared to the Ventura County value.
US Value
(73.6%)
The regional value is compared to the national value.
Adults who have had a Routine Checkup Census Place (City): Oak Park
Adults who have had a Routine Checkup Census Place (City): Oak Park
64.5%
(2021)
Compared to:
CA Census Places
The distribution is based on data from 1,472 locales.
U.S. Census Places
The distribution is based on data from 27,528 U.S. Census Places.
Ventura, CA County Value
(64.4%)
The regional value is compared to the Ventura County value.
US Value
(73.6%)
The regional value is compared to the national value.
Adults who have had a Routine Checkup Census Place (City): Oak View
Adults who have had a Routine Checkup Census Place (City): Oak View
63.0%
(2021)
Compared to:
CA Census Places
The distribution is based on data from 1,472 locales.
U.S. Census Places
The distribution is based on data from 27,528 U.S. Census Places.
Ventura, CA County Value
(64.4%)
The regional value is compared to the Ventura County value.
US Value
(73.6%)
The regional value is compared to the national value.
Adults who have had a Routine Checkup Census Place (City): Ojai
Adults who have had a Routine Checkup Census Place (City): Ojai
67.4%
(2021)
Compared to:
CA Census Places
The distribution is based on data from 1,472 locales.
U.S. Census Places
The distribution is based on data from 27,528 U.S. Census Places.
Ventura, CA County Value
(64.4%)
The regional value is compared to the Ventura County value.
US Value
(73.6%)
The regional value is compared to the national value.
Adults who have had a Routine Checkup Census Place (City): Oxnard
Adults who have had a Routine Checkup Census Place (City): Oxnard
59.6%
(2021)
Compared to:
CA Census Places
The distribution is based on data from 1,472 locales.
U.S. Census Places
The distribution is based on data from 27,528 U.S. Census Places.
Ventura, CA County Value
(64.4%)
The regional value is compared to the Ventura County value.
US Value
(73.6%)
The regional value is compared to the national value.
Adults who have had a Routine Checkup Census Place (City): Piru
Adults who have had a Routine Checkup Census Place (City): Piru
59.2%
(2021)
Compared to:
CA Census Places
The distribution is based on data from 1,472 locales.
U.S. Census Places
The distribution is based on data from 27,528 U.S. Census Places.
Ventura, CA County Value
(64.4%)
The regional value is compared to the Ventura County value.
US Value
(73.6%)
The regional value is compared to the national value.
Adults who have had a Routine Checkup Census Place (City): Port Hueneme
Adults who have had a Routine Checkup Census Place (City): Port Hueneme
61.2%
(2021)
Compared to:
CA Census Places
The distribution is based on data from 1,472 locales.
U.S. Census Places
The distribution is based on data from 27,528 U.S. Census Places.
Ventura, CA County Value
(64.4%)
The regional value is compared to the Ventura County value.
US Value
(73.6%)
The regional value is compared to the national value.
Adults who have had a Routine Checkup Census Place (City): San Buenaventura (Ventura)
Adults who have had a Routine Checkup Census Place (City): San Buenaventura (Ventura)
63.5%
(2021)
Compared to:
CA Census Places
The distribution is based on data from 1,472 locales.
U.S. Census Places
The distribution is based on data from 27,528 U.S. Census Places.
Ventura, CA County Value
(64.4%)
The regional value is compared to the Ventura County value.
US Value
(73.6%)
The regional value is compared to the national value.
Adults who have had a Routine Checkup Census Place (City): Santa Paula
Adults who have had a Routine Checkup Census Place (City): Santa Paula
60.5%
(2021)
Compared to:
CA Census Places
The distribution is based on data from 1,472 locales.
U.S. Census Places
The distribution is based on data from 27,528 U.S. Census Places.
Ventura, CA County Value
(64.4%)
The regional value is compared to the Ventura County value.
US Value
(73.6%)
The regional value is compared to the national value.
Adults who have had a Routine Checkup Census Place (City): Santa Rosa Valley
Adults who have had a Routine Checkup Census Place (City): Santa Rosa Valley
67.4%
(2021)
Compared to:
CA Census Places
The distribution is based on data from 1,472 locales.
U.S. Census Places
The distribution is based on data from 27,528 U.S. Census Places.
Ventura, CA County Value
(64.4%)
The regional value is compared to the Ventura County value.
US Value
(73.6%)
The regional value is compared to the national value.
Adults who have had a Routine Checkup Census Place (City): Santa Susana
Adults who have had a Routine Checkup Census Place (City): Santa Susana
63.1%
(2021)
Compared to:
CA Census Places
The distribution is based on data from 1,472 locales.
U.S. Census Places
The distribution is based on data from 27,528 U.S. Census Places.
Ventura, CA County Value
(64.4%)
The regional value is compared to the Ventura County value.
US Value
(73.6%)
The regional value is compared to the national value.
Adults who have had a Routine Checkup Census Place (City): Saticoy
Adults who have had a Routine Checkup Census Place (City): Saticoy
59.4%
(2021)
Compared to:
CA Census Places
The distribution is based on data from 1,472 locales.
U.S. Census Places
The distribution is based on data from 27,528 U.S. Census Places.
Ventura, CA County Value
(64.4%)
The regional value is compared to the Ventura County value.
US Value
(73.6%)
The regional value is compared to the national value.
Adults who have had a Routine Checkup Census Place (City): Simi Valley
Adults who have had a Routine Checkup Census Place (City): Simi Valley
62.7%
(2021)
Compared to:
CA Census Places
The distribution is based on data from 1,472 locales.
U.S. Census Places
The distribution is based on data from 27,528 U.S. Census Places.
Ventura, CA County Value
(64.4%)
The regional value is compared to the Ventura County value.
US Value
(73.6%)
The regional value is compared to the national value.
Adults who have had a Routine Checkup Census Place (City): Thousand Oaks
Adults who have had a Routine Checkup Census Place (City): Thousand Oaks
65.1%
(2021)
Compared to:
CA Census Places
The distribution is based on data from 1,472 locales.
U.S. Census Places
The distribution is based on data from 27,528 U.S. Census Places.
Ventura, CA County Value
(64.4%)
The regional value is compared to the Ventura County value.
US Value
(73.6%)
The regional value is compared to the national value.
Adults who have had a Routine Checkup Zip Code: 91320
Adults who have had a Routine Checkup Zip Code: 91320
64.2%
(2021)
Compared to:
CA Zip Codes
The distribution is based on data from 1,730 California zip codes.
U.S. Zip Codes
The distribution is based on data from 31,435 U.S. zip codes.
Ventura, CA County Value
(64.4%)
The regional value is compared to the Ventura County value.
US Value
(73.6%)
The regional value is compared to the national value.
Adults who have had a Routine Checkup Zip Code: 91360
Adults who have had a Routine Checkup Zip Code: 91360
65.1%
(2021)
Compared to:
CA Zip Codes
The distribution is based on data from 1,730 California zip codes.
U.S. Zip Codes
The distribution is based on data from 31,435 U.S. zip codes.
Ventura, CA County Value
(64.4%)
The regional value is compared to the Ventura County value.
US Value
(73.6%)
The regional value is compared to the national value.
Adults who have had a Routine Checkup Zip Code: 91361
Adults who have had a Routine Checkup Zip Code: 91361
68.4%
(2021)
Compared to:
CA Zip Codes
The distribution is based on data from 1,730 California zip codes.
U.S. Zip Codes
The distribution is based on data from 31,435 U.S. zip codes.
Ventura, CA County Value
(64.4%)
The regional value is compared to the Ventura County value.
US Value
(73.6%)
The regional value is compared to the national value.
Adults who have had a Routine Checkup Zip Code: 91362
Adults who have had a Routine Checkup Zip Code: 91362
65.3%
(2021)
Compared to:
CA Zip Codes
The distribution is based on data from 1,730 California zip codes.
U.S. Zip Codes
The distribution is based on data from 31,435 U.S. zip codes.
Ventura, CA County Value
(64.4%)
The regional value is compared to the Ventura County value.
US Value
(73.6%)
The regional value is compared to the national value.
Adults who have had a Routine Checkup Zip Code: 91377
Adults who have had a Routine Checkup Zip Code: 91377
64.5%
(2021)
Compared to:
CA Zip Codes
The distribution is based on data from 1,730 California zip codes.
U.S. Zip Codes
The distribution is based on data from 31,435 U.S. zip codes.
Ventura, CA County Value
(64.4%)
The regional value is compared to the Ventura County value.
US Value
(73.6%)
The regional value is compared to the national value.
Adults who have had a Routine Checkup Zip Code: 93001
Adults who have had a Routine Checkup Zip Code: 93001
62.0%
(2021)
Compared to:
CA Zip Codes
The distribution is based on data from 1,730 California zip codes.
U.S. Zip Codes
The distribution is based on data from 31,435 U.S. zip codes.
Ventura, CA County Value
(64.4%)
The regional value is compared to the Ventura County value.
US Value
(73.6%)
The regional value is compared to the national value.
Adults who have had a Routine Checkup Zip Code: 93003
Adults who have had a Routine Checkup Zip Code: 93003
64.1%
(2021)
Compared to:
CA Zip Codes
The distribution is based on data from 1,730 California zip codes.
U.S. Zip Codes
The distribution is based on data from 31,435 U.S. zip codes.
Ventura, CA County Value
(64.4%)
The regional value is compared to the Ventura County value.
US Value
(73.6%)
The regional value is compared to the national value.
Adults who have had a Routine Checkup Zip Code: 93004
Adults who have had a Routine Checkup Zip Code: 93004
64.1%
(2021)
Compared to:
CA Zip Codes
The distribution is based on data from 1,730 California zip codes.
U.S. Zip Codes
The distribution is based on data from 31,435 U.S. zip codes.
Ventura, CA County Value
(64.4%)
The regional value is compared to the Ventura County value.
US Value
(73.6%)
The regional value is compared to the national value.
Adults who have had a Routine Checkup Zip Code: 93010
Adults who have had a Routine Checkup Zip Code: 93010
65.2%
(2021)
Compared to:
CA Zip Codes
The distribution is based on data from 1,730 California zip codes.
U.S. Zip Codes
The distribution is based on data from 31,435 U.S. zip codes.
Ventura, CA County Value
(64.4%)
The regional value is compared to the Ventura County value.
US Value
(73.6%)
The regional value is compared to the national value.
Adults who have had a Routine Checkup Zip Code: 93012
Adults who have had a Routine Checkup Zip Code: 93012
66.0%
(2021)
Compared to:
CA Zip Codes
The distribution is based on data from 1,730 California zip codes.
U.S. Zip Codes
The distribution is based on data from 31,435 U.S. zip codes.
Ventura, CA County Value
(64.4%)
The regional value is compared to the Ventura County value.
US Value
(73.6%)
The regional value is compared to the national value.
Adults who have had a Routine Checkup Zip Code: 93015
Adults who have had a Routine Checkup Zip Code: 93015
61.2%
(2021)
Compared to:
CA Zip Codes
The distribution is based on data from 1,730 California zip codes.
U.S. Zip Codes
The distribution is based on data from 31,435 U.S. zip codes.
Ventura, CA County Value
(64.4%)
The regional value is compared to the Ventura County value.
US Value
(73.6%)
The regional value is compared to the national value.
Adults who have had a Routine Checkup Zip Code: 93021
Adults who have had a Routine Checkup Zip Code: 93021
61.9%
(2021)
Compared to:
CA Zip Codes
The distribution is based on data from 1,730 California zip codes.
U.S. Zip Codes
The distribution is based on data from 31,435 U.S. zip codes.
Ventura, CA County Value
(64.4%)
The regional value is compared to the Ventura County value.
US Value
(73.6%)
The regional value is compared to the national value.
Adults who have had a Routine Checkup Zip Code: 93022
Adults who have had a Routine Checkup Zip Code: 93022
64.1%
(2021)
Compared to:
CA Zip Codes
The distribution is based on data from 1,730 California zip codes.
U.S. Zip Codes
The distribution is based on data from 31,435 U.S. zip codes.
Ventura, CA County Value
(64.4%)
The regional value is compared to the Ventura County value.
US Value
(73.6%)
The regional value is compared to the national value.
Adults who have had a Routine Checkup Zip Code: 93023
Adults who have had a Routine Checkup Zip Code: 93023
66.8%
(2021)
Compared to:
CA Zip Codes
The distribution is based on data from 1,730 California zip codes.
U.S. Zip Codes
The distribution is based on data from 31,435 U.S. zip codes.
Ventura, CA County Value
(64.4%)
The regional value is compared to the Ventura County value.
US Value
(73.6%)
The regional value is compared to the national value.
Adults who have had a Routine Checkup Zip Code: 93030
Adults who have had a Routine Checkup Zip Code: 93030
59.5%
(2021)
Compared to:
CA Zip Codes
The distribution is based on data from 1,730 California zip codes.
U.S. Zip Codes
The distribution is based on data from 31,435 U.S. zip codes.
Ventura, CA County Value
(64.4%)
The regional value is compared to the Ventura County value.
US Value
(73.6%)
The regional value is compared to the national value.
Adults who have had a Routine Checkup Zip Code: 93033
Adults who have had a Routine Checkup Zip Code: 93033
58.2%
(2021)
Compared to:
CA Zip Codes
The distribution is based on data from 1,730 California zip codes.
U.S. Zip Codes
The distribution is based on data from 31,435 U.S. zip codes.
Ventura, CA County Value
(64.4%)
The regional value is compared to the Ventura County value.
US Value
(73.6%)
The regional value is compared to the national value.
Adults who have had a Routine Checkup Zip Code: 93035
Adults who have had a Routine Checkup Zip Code: 93035
63.4%
(2021)
Compared to:
CA Zip Codes
The distribution is based on data from 1,730 California zip codes.
U.S. Zip Codes
The distribution is based on data from 31,435 U.S. zip codes.
Ventura, CA County Value
(64.4%)
The regional value is compared to the Ventura County value.
US Value
(73.6%)
The regional value is compared to the national value.
Adults who have had a Routine Checkup Zip Code: 93036
Adults who have had a Routine Checkup Zip Code: 93036
60.0%
(2021)
Compared to:
CA Zip Codes
The distribution is based on data from 1,730 California zip codes.
U.S. Zip Codes
The distribution is based on data from 31,435 U.S. zip codes.
Ventura, CA County Value
(64.4%)
The regional value is compared to the Ventura County value.
US Value
(73.6%)
The regional value is compared to the national value.
Adults who have had a Routine Checkup Zip Code: 93040
Adults who have had a Routine Checkup Zip Code: 93040
59.0%
(2021)
Compared to:
CA Zip Codes
The distribution is based on data from 1,730 California zip codes.
U.S. Zip Codes
The distribution is based on data from 31,435 U.S. zip codes.
Ventura, CA County Value
(64.4%)
The regional value is compared to the Ventura County value.
US Value
(73.6%)
The regional value is compared to the national value.
Adults who have had a Routine Checkup Zip Code: 93041
Adults who have had a Routine Checkup Zip Code: 93041
60.7%
(2021)
Compared to:
CA Zip Codes
The distribution is based on data from 1,730 California zip codes.
U.S. Zip Codes
The distribution is based on data from 31,435 U.S. zip codes.
Ventura, CA County Value
(64.4%)
The regional value is compared to the Ventura County value.
US Value
(73.6%)
The regional value is compared to the national value.
Adults who have had a Routine Checkup Zip Code: 93042
Adults who have had a Routine Checkup Zip Code: 93042
48.1%
(2021)
Compared to:
CA Zip Codes
The distribution is based on data from 1,730 California zip codes.
U.S. Zip Codes
The distribution is based on data from 31,435 U.S. zip codes.
Ventura, CA County Value
(64.4%)
The regional value is compared to the Ventura County value.
US Value
(73.6%)
The regional value is compared to the national value.
Adults who have had a Routine Checkup Zip Code: 93043
Adults who have had a Routine Checkup Zip Code: 93043
52.6%
(2021)
Compared to:
CA Zip Codes
The distribution is based on data from 1,730 California zip codes.
U.S. Zip Codes
The distribution is based on data from 31,435 U.S. zip codes.
Ventura, CA County Value
(64.4%)
The regional value is compared to the Ventura County value.
US Value
(73.6%)
The regional value is compared to the national value.
Adults who have had a Routine Checkup Zip Code: 93060
Adults who have had a Routine Checkup Zip Code: 93060
60.6%
(2021)
Compared to:
CA Zip Codes
The distribution is based on data from 1,730 California zip codes.
U.S. Zip Codes
The distribution is based on data from 31,435 U.S. zip codes.
Ventura, CA County Value
(64.4%)
The regional value is compared to the Ventura County value.
US Value
(73.6%)
The regional value is compared to the national value.
Adults who have had a Routine Checkup Zip Code: 93063
Adults who have had a Routine Checkup Zip Code: 93063
63.2%
(2021)
Compared to:
CA Zip Codes
The distribution is based on data from 1,730 California zip codes.
U.S. Zip Codes
The distribution is based on data from 31,435 U.S. zip codes.
Ventura, CA County Value
(64.4%)
The regional value is compared to the Ventura County value.
US Value
(73.6%)
The regional value is compared to the national value.
Adults who have had a Routine Checkup Zip Code: 93065
Adults who have had a Routine Checkup Zip Code: 93065
62.4%
(2021)
Compared to:
CA Zip Codes
The distribution is based on data from 1,730 California zip codes.
U.S. Zip Codes
The distribution is based on data from 31,435 U.S. zip codes.
Ventura, CA County Value
(64.4%)
The regional value is compared to the Ventura County value.
US Value
(73.6%)
The regional value is compared to the national value.
Adults who have had a Routine Checkup Zip Code: 93066
Adults who have had a Routine Checkup Zip Code: 93066
65.0%
(2021)
Compared to:
CA Zip Codes
The distribution is based on data from 1,730 California zip codes.
U.S. Zip Codes
The distribution is based on data from 31,435 U.S. zip codes.
Ventura, CA County Value
(64.4%)
The regional value is compared to the Ventura County value.
US Value
(73.6%)
The regional value is compared to the national value.
Adults who have had a Routine Checkup Census Tract: 06111000100
Adults who have had a Routine Checkup Census Tract: 06111000100
66.6%
(2021)
Compared to:
CA Census Tracts
The distribution is based on data from 8,005 California census tracts.
U.S. Census Tracts
The distribution is based on data from 68,167 U.S. census tracts.
Ventura, CA County Value
(64.4%)
The regional value is compared to the Ventura County value.
US Value
(73.6%)
The regional value is compared to the national value.
Adults who have had a Routine Checkup Census Tract: 06111000200
Adults who have had a Routine Checkup Census Tract: 06111000200
58.8%
(2021)
Compared to:
CA Census Tracts
The distribution is based on data from 8,005 California census tracts.
U.S. Census Tracts
The distribution is based on data from 68,167 U.S. census tracts.
Ventura, CA County Value
(64.4%)
The regional value is compared to the Ventura County value.
US Value
(73.6%)
The regional value is compared to the national value.
Adults who have had a Routine Checkup Census Tract: 06111000302
Adults who have had a Routine Checkup Census Tract: 06111000302
62.7%
(2021)
Compared to:
CA Census Tracts
The distribution is based on data from 8,005 California census tracts.
U.S. Census Tracts
The distribution is based on data from 68,167 U.S. census tracts.
Ventura, CA County Value
(64.4%)
The regional value is compared to the Ventura County value.
US Value
(73.6%)
The regional value is compared to the national value.
Adults who have had a Routine Checkup Census Tract: 06111000303
Adults who have had a Routine Checkup Census Tract: 06111000303
60.7%
(2021)
Compared to:
CA Census Tracts
The distribution is based on data from 8,005 California census tracts.
U.S. Census Tracts
The distribution is based on data from 68,167 U.S. census tracts.
Ventura, CA County Value
(64.4%)
The regional value is compared to the Ventura County value.
US Value
(73.6%)
The regional value is compared to the national value.
Adults who have had a Routine Checkup Census Tract: 06111000304
Adults who have had a Routine Checkup Census Tract: 06111000304
59.8%
(2021)
Compared to:
CA Census Tracts
The distribution is based on data from 8,005 California census tracts.
U.S. Census Tracts
The distribution is based on data from 68,167 U.S. census tracts.
Ventura, CA County Value
(64.4%)
The regional value is compared to the Ventura County value.
US Value
(73.6%)
The regional value is compared to the national value.
Adults who have had a Routine Checkup Census Tract: 06111000400
Adults who have had a Routine Checkup Census Tract: 06111000400
60.8%
(2021)
Compared to:
CA Census Tracts
The distribution is based on data from 8,005 California census tracts.
U.S. Census Tracts
The distribution is based on data from 68,167 U.S. census tracts.
Ventura, CA County Value
(64.4%)
The regional value is compared to the Ventura County value.
US Value
(73.6%)
The regional value is compared to the national value.
Adults who have had a Routine Checkup Census Tract: 06111000500
Adults who have had a Routine Checkup Census Tract: 06111000500
63.6%
(2021)
Compared to:
CA Census Tracts
The distribution is based on data from 8,005 California census tracts.
U.S. Census Tracts
The distribution is based on data from 68,167 U.S. census tracts.
Ventura, CA County Value
(64.4%)
The regional value is compared to the Ventura County value.
US Value
(73.6%)
The regional value is compared to the national value.
Adults who have had a Routine Checkup Census Tract: 06111000600
Adults who have had a Routine Checkup Census Tract: 06111000600
58.1%
(2021)
Compared to:
CA Census Tracts
The distribution is based on data from 8,005 California census tracts.
U.S. Census Tracts
The distribution is based on data from 68,167 U.S. census tracts.
Ventura, CA County Value
(64.4%)
The regional value is compared to the Ventura County value.
US Value
(73.6%)
The regional value is compared to the national value.
Adults who have had a Routine Checkup Census Tract: 06111000701
Adults who have had a Routine Checkup Census Tract: 06111000701
57.9%
(2021)
Compared to:
CA Census Tracts
The distribution is based on data from 8,005 California census tracts.
U.S. Census Tracts
The distribution is based on data from 68,167 U.S. census tracts.
Ventura, CA County Value
(64.4%)
The regional value is compared to the Ventura County value.
US Value
(73.6%)
The regional value is compared to the national value.
Adults who have had a Routine Checkup Census Tract: 06111000702
Adults who have had a Routine Checkup Census Tract: 06111000702
61.4%
(2021)
Compared to:
CA Census Tracts
The distribution is based on data from 8,005 California census tracts.
U.S. Census Tracts
The distribution is based on data from 68,167 U.S. census tracts.
Ventura, CA County Value
(64.4%)
The regional value is compared to the Ventura County value.
US Value
(73.6%)
The regional value is compared to the national value.
Adults who have had a Routine Checkup Census Tract: 06111000800
Adults who have had a Routine Checkup Census Tract: 06111000800
62.6%
(2021)
Compared to:
CA Census Tracts
The distribution is based on data from 8,005 California census tracts.
U.S. Census Tracts
The distribution is based on data from 68,167 U.S. census tracts.
Ventura, CA County Value
(64.4%)
The regional value is compared to the Ventura County value.
US Value
(73.6%)
The regional value is compared to the national value.
Adults who have had a Routine Checkup Census Tract: 06111000901
Adults who have had a Routine Checkup Census Tract: 06111000901
70.8%
(2021)
Compared to:
CA Census Tracts
The distribution is based on data from 8,005 California census tracts.
U.S. Census Tracts
The distribution is based on data from 68,167 U.S. census tracts.
Ventura, CA County Value
(64.4%)
The regional value is compared to the Ventura County value.
US Value
(73.6%)
The regional value is compared to the national value.
Adults who have had a Routine Checkup Census Tract: 06111000902
Adults who have had a Routine Checkup Census Tract: 06111000902
67.4%
(2021)
Compared to:
CA Census Tracts
The distribution is based on data from 8,005 California census tracts.
U.S. Census Tracts
The distribution is based on data from 68,167 U.S. census tracts.
Ventura, CA County Value
(64.4%)
The regional value is compared to the Ventura County value.
US Value
(73.6%)
The regional value is compared to the national value.
Adults who have had a Routine Checkup Census Tract: 06111000903
Adults who have had a Routine Checkup Census Tract: 06111000903
65.8%
(2021)
Compared to:
CA Census Tracts
The distribution is based on data from 8,005 California census tracts.
U.S. Census Tracts
The distribution is based on data from 68,167 U.S. census tracts.
Ventura, CA County Value
(64.4%)
The regional value is compared to the Ventura County value.
US Value
(73.6%)
The regional value is compared to the national value.
Adults who have had a Routine Checkup Census Tract: 06111001001
Adults who have had a Routine Checkup Census Tract: 06111001001
65.3%
(2021)
Compared to:
CA Census Tracts
The distribution is based on data from 8,005 California census tracts.
U.S. Census Tracts
The distribution is based on data from 68,167 U.S. census tracts.
Ventura, CA County Value
(64.4%)
The regional value is compared to the Ventura County value.
US Value
(73.6%)
The regional value is compared to the national value.
Adults who have had a Routine Checkup Census Tract: 06111001002
Adults who have had a Routine Checkup Census Tract: 06111001002
65.7%
(2021)
Compared to:
CA Census Tracts
The distribution is based on data from 8,005 California census tracts.
U.S. Census Tracts
The distribution is based on data from 68,167 U.S. census tracts.
Ventura, CA County Value
(64.4%)
The regional value is compared to the Ventura County value.
US Value
(73.6%)
The regional value is compared to the national value.
Adults who have had a Routine Checkup Census Tract: 06111001101
Adults who have had a Routine Checkup Census Tract: 06111001101
64.1%
(2021)
Compared to:
CA Census Tracts
The distribution is based on data from 8,005 California census tracts.
U.S. Census Tracts
The distribution is based on data from 68,167 U.S. census tracts.
Ventura, CA County Value
(64.4%)
The regional value is compared to the Ventura County value.
US Value
(73.6%)
The regional value is compared to the national value.
Adults who have had a Routine Checkup Census Tract: 06111001102
Adults who have had a Routine Checkup Census Tract: 06111001102
65.8%
(2021)
Compared to:
CA Census Tracts
The distribution is based on data from 8,005 California census tracts.
U.S. Census Tracts
The distribution is based on data from 68,167 U.S. census tracts.
Ventura, CA County Value
(64.4%)
The regional value is compared to the Ventura County value.
US Value
(73.6%)
The regional value is compared to the national value.
Adults who have had a Routine Checkup Census Tract: 06111001201
Adults who have had a Routine Checkup Census Tract: 06111001201
65.8%
(2021)
Compared to:
CA Census Tracts
The distribution is based on data from 8,005 California census tracts.
U.S. Census Tracts
The distribution is based on data from 68,167 U.S. census tracts.
Ventura, CA County Value
(64.4%)
The regional value is compared to the Ventura County value.
US Value
(73.6%)
The regional value is compared to the national value.
Adults who have had a Routine Checkup Census Tract: 06111001202
Adults who have had a Routine Checkup Census Tract: 06111001202
65.2%
(2021)
Compared to:
CA Census Tracts
The distribution is based on data from 8,005 California census tracts.
U.S. Census Tracts
The distribution is based on data from 68,167 U.S. census tracts.
Ventura, CA County Value
(64.4%)
The regional value is compared to the Ventura County value.
US Value
(73.6%)
The regional value is compared to the national value.
Adults who have had a Routine Checkup Census Tract: 06111001204
Adults who have had a Routine Checkup Census Tract: 06111001204
61.7%
(2021)
Compared to:
CA Census Tracts
The distribution is based on data from 8,005 California census tracts.
U.S. Census Tracts
The distribution is based on data from 68,167 U.S. census tracts.
Ventura, CA County Value
(64.4%)
The regional value is compared to the Ventura County value.
US Value
(73.6%)
The regional value is compared to the national value.
Adults who have had a Routine Checkup Census Tract: 06111001206
Adults who have had a Routine Checkup Census Tract: 06111001206
67.2%
(2021)
Compared to:
CA Census Tracts
The distribution is based on data from 8,005 California census tracts.
U.S. Census Tracts
The distribution is based on data from 68,167 U.S. census tracts.
Ventura, CA County Value
(64.4%)
The regional value is compared to the Ventura County value.
US Value
(73.6%)
The regional value is compared to the national value.
Adults who have had a Routine Checkup Census Tract: 06111001301
Adults who have had a Routine Checkup Census Tract: 06111001301
61.1%
(2021)
Compared to:
CA Census Tracts
The distribution is based on data from 8,005 California census tracts.
U.S. Census Tracts
The distribution is based on data from 68,167 U.S. census tracts.
Ventura, CA County Value
(64.4%)
The regional value is compared to the Ventura County value.
US Value
(73.6%)
The regional value is compared to the national value.
Adults who have had a Routine Checkup Census Tract: 06111001302
Adults who have had a Routine Checkup Census Tract: 06111001302
67.9%
(2021)
Compared to:
CA Census Tracts
The distribution is based on data from 8,005 California census tracts.
U.S. Census Tracts
The distribution is based on data from 68,167 U.S. census tracts.
Ventura, CA County Value
(64.4%)
The regional value is compared to the Ventura County value.
US Value
(73.6%)
The regional value is compared to the national value.
Adults who have had a Routine Checkup Census Tract: 06111001401
Adults who have had a Routine Checkup Census Tract: 06111001401
65.1%
(2021)
Compared to:
CA Census Tracts
The distribution is based on data from 8,005 California census tracts.
U.S. Census Tracts
The distribution is based on data from 68,167 U.S. census tracts.
Ventura, CA County Value
(64.4%)
The regional value is compared to the Ventura County value.
US Value
(73.6%)
The regional value is compared to the national value.
Adults who have had a Routine Checkup Census Tract: 06111001402
Adults who have had a Routine Checkup Census Tract: 06111001402
63.8%
(2021)
Compared to:
CA Census Tracts
The distribution is based on data from 8,005 California census tracts.
U.S. Census Tracts
The distribution is based on data from 68,167 U.S. census tracts.
Ventura, CA County Value
(64.4%)
The regional value is compared to the Ventura County value.
US Value
(73.6%)
The regional value is compared to the national value.
Adults who have had a Routine Checkup Census Tract: 06111001502
Adults who have had a Routine Checkup Census Tract: 06111001502
62.7%
(2021)
Compared to:
CA Census Tracts
The distribution is based on data from 8,005 California census tracts.
U.S. Census Tracts
The distribution is based on data from 68,167 U.S. census tracts.
Ventura, CA County Value
(64.4%)
The regional value is compared to the Ventura County value.
US Value
(73.6%)
The regional value is compared to the national value.
Adults who have had a Routine Checkup Census Tract: 06111001503
Adults who have had a Routine Checkup Census Tract: 06111001503
59.9%
(2021)
Compared to:
CA Census Tracts
The distribution is based on data from 8,005 California census tracts.
U.S. Census Tracts
The distribution is based on data from 68,167 U.S. census tracts.
Ventura, CA County Value
(64.4%)
The regional value is compared to the Ventura County value.
US Value
(73.6%)
The regional value is compared to the national value.
Adults who have had a Routine Checkup Census Tract: 06111001506
Adults who have had a Routine Checkup Census Tract: 06111001506
63.8%
(2021)
Compared to:
CA Census Tracts
The distribution is based on data from 8,005 California census tracts.
U.S. Census Tracts
The distribution is based on data from 68,167 U.S. census tracts.
Ventura, CA County Value
(64.4%)
The regional value is compared to the Ventura County value.
US Value
(73.6%)
The regional value is compared to the national value.
Adults who have had a Routine Checkup Census Tract: 06111001507
Adults who have had a Routine Checkup Census Tract: 06111001507
62.4%
(2021)
Compared to:
CA Census Tracts
The distribution is based on data from 8,005 California census tracts.
U.S. Census Tracts
The distribution is based on data from 68,167 U.S. census tracts.
Ventura, CA County Value
(64.4%)
The regional value is compared to the Ventura County value.
US Value
(73.6%)
The regional value is compared to the national value.
Adults who have had a Routine Checkup Census Tract: 06111001601
Adults who have had a Routine Checkup Census Tract: 06111001601
62.2%
(2021)
Compared to:
CA Census Tracts
The distribution is based on data from 8,005 California census tracts.
U.S. Census Tracts
The distribution is based on data from 68,167 U.S. census tracts.
Ventura, CA County Value
(64.4%)
The regional value is compared to the Ventura County value.
US Value
(73.6%)
The regional value is compared to the national value.
Adults who have had a Routine Checkup Census Tract: 06111001602
Adults who have had a Routine Checkup Census Tract: 06111001602
67.9%
(2021)
Compared to:
CA Census Tracts
The distribution is based on data from 8,005 California census tracts.
U.S. Census Tracts
The distribution is based on data from 68,167 U.S. census tracts.
Ventura, CA County Value
(64.4%)
The regional value is compared to the Ventura County value.
US Value
(73.6%)
The regional value is compared to the national value.
Adults who have had a Routine Checkup Census Tract: 06111001700
Adults who have had a Routine Checkup Census Tract: 06111001700
69.2%
(2021)
Compared to:
CA Census Tracts
The distribution is based on data from 8,005 California census tracts.
U.S. Census Tracts
The distribution is based on data from 68,167 U.S. census tracts.
Ventura, CA County Value
(64.4%)
The regional value is compared to the Ventura County value.
US Value
(73.6%)
The regional value is compared to the national value.
Adults who have had a Routine Checkup Census Tract: 06111001800
Adults who have had a Routine Checkup Census Tract: 06111001800
67.9%
(2021)
Compared to:
CA Census Tracts
The distribution is based on data from 8,005 California census tracts.
U.S. Census Tracts
The distribution is based on data from 68,167 U.S. census tracts.
Ventura, CA County Value
(64.4%)
The regional value is compared to the Ventura County value.
US Value
(73.6%)
The regional value is compared to the national value.
Adults who have had a Routine Checkup Census Tract: 06111001900
Adults who have had a Routine Checkup Census Tract: 06111001900
66.3%
(2021)
Compared to:
CA Census Tracts
The distribution is based on data from 8,005 California census tracts.
U.S. Census Tracts
The distribution is based on data from 68,167 U.S. census tracts.
Ventura, CA County Value
(64.4%)
The regional value is compared to the Ventura County value.
US Value
(73.6%)
The regional value is compared to the national value.
Adults who have had a Routine Checkup Census Tract: 06111002000
Adults who have had a Routine Checkup Census Tract: 06111002000
67.3%
(2021)
Compared to:
CA Census Tracts
The distribution is based on data from 8,005 California census tracts.
U.S. Census Tracts
The distribution is based on data from 68,167 U.S. census tracts.
Ventura, CA County Value
(64.4%)
The regional value is compared to the Ventura County value.
US Value
(73.6%)
The regional value is compared to the national value.
Adults who have had a Routine Checkup Census Tract: 06111002102
Adults who have had a Routine Checkup Census Tract: 06111002102
62.7%
(2021)
Compared to:
CA Census Tracts
The distribution is based on data from 8,005 California census tracts.
U.S. Census Tracts
The distribution is based on data from 68,167 U.S. census tracts.
Ventura, CA County Value
(64.4%)
The regional value is compared to the Ventura County value.
US Value
(73.6%)
The regional value is compared to the national value.
Adults who have had a Routine Checkup Census Tract: 06111002200
Adults who have had a Routine Checkup Census Tract: 06111002200
59.6%
(2021)
Compared to:
CA Census Tracts
The distribution is based on data from 8,005 California census tracts.
U.S. Census Tracts
The distribution is based on data from 68,167 U.S. census tracts.
Ventura, CA County Value
(64.4%)
The regional value is compared to the Ventura County value.
US Value
(73.6%)
The regional value is compared to the national value.
Adults who have had a Routine Checkup Census Tract: 06111002300
Adults who have had a Routine Checkup Census Tract: 06111002300
57.1%
(2021)
Compared to:
CA Census Tracts
The distribution is based on data from 8,005 California census tracts.
U.S. Census Tracts
The distribution is based on data from 68,167 U.S. census tracts.
Ventura, CA County Value
(64.4%)
The regional value is compared to the Ventura County value.
US Value
(73.6%)
The regional value is compared to the national value.
Adults who have had a Routine Checkup Census Tract: 06111002400
Adults who have had a Routine Checkup Census Tract: 06111002400
61.4%
(2021)
Compared to:
CA Census Tracts
The distribution is based on data from 8,005 California census tracts.
U.S. Census Tracts
The distribution is based on data from 68,167 U.S. census tracts.
Ventura, CA County Value
(64.4%)
The regional value is compared to the Ventura County value.
US Value
(73.6%)
The regional value is compared to the national value.
Adults who have had a Routine Checkup Census Tract: 06111002500
Adults who have had a Routine Checkup Census Tract: 06111002500
67.5%
(2021)
Compared to:
CA Census Tracts
The distribution is based on data from 8,005 California census tracts.
U.S. Census Tracts
The distribution is based on data from 68,167 U.S. census tracts.
Ventura, CA County Value
(64.4%)
The regional value is compared to the Ventura County value.
US Value
(73.6%)
The regional value is compared to the national value.
Adults who have had a Routine Checkup Census Tract: 06111002600
Adults who have had a Routine Checkup Census Tract: 06111002600
61.3%
(2021)
Compared to:
CA Census Tracts
The distribution is based on data from 8,005 California census tracts.
U.S. Census Tracts
The distribution is based on data from 68,167 U.S. census tracts.
Ventura, CA County Value
(64.4%)
The regional value is compared to the Ventura County value.
US Value
(73.6%)
The regional value is compared to the national value.
Adults who have had a Routine Checkup Census Tract: 06111002700
Adults who have had a Routine Checkup Census Tract: 06111002700
66.1%
(2021)
Compared to:
CA Census Tracts
The distribution is based on data from 8,005 California census tracts.
U.S. Census Tracts
The distribution is based on data from 68,167 U.S. census tracts.
Ventura, CA County Value
(64.4%)
The regional value is compared to the Ventura County value.
US Value
(73.6%)
The regional value is compared to the national value.
Adults who have had a Routine Checkup Census Tract: 06111002800
Adults who have had a Routine Checkup Census Tract: 06111002800
62.0%
(2021)
Compared to:
CA Census Tracts
The distribution is based on data from 8,005 California census tracts.
U.S. Census Tracts
The distribution is based on data from 68,167 U.S. census tracts.
Ventura, CA County Value
(64.4%)
The regional value is compared to the Ventura County value.
US Value
(73.6%)
The regional value is compared to the national value.
Adults who have had a Routine Checkup Census Tract: 06111002901
Adults who have had a Routine Checkup Census Tract: 06111002901
65.0%
(2021)
Compared to:
CA Census Tracts
The distribution is based on data from 8,005 California census tracts.
U.S. Census Tracts
The distribution is based on data from 68,167 U.S. census tracts.
Ventura, CA County Value
(64.4%)
The regional value is compared to the Ventura County value.
US Value
(73.6%)
The regional value is compared to the national value.
Adults who have had a Routine Checkup Census Tract: 06111002905
Adults who have had a Routine Checkup Census Tract: 06111002905
63.3%
(2021)
Compared to:
CA Census Tracts
The distribution is based on data from 8,005 California census tracts.
U.S. Census Tracts
The distribution is based on data from 68,167 U.S. census tracts.
Ventura, CA County Value
(64.4%)
The regional value is compared to the Ventura County value.
US Value
(73.6%)
The regional value is compared to the national value.
Adults who have had a Routine Checkup Census Tract: 06111003010
Adults who have had a Routine Checkup Census Tract: 06111003010
60.3%
(2021)
Compared to:
CA Census Tracts
The distribution is based on data from 8,005 California census tracts.
U.S. Census Tracts
The distribution is based on data from 68,167 U.S. census tracts.
Ventura, CA County Value
(64.4%)
The regional value is compared to the Ventura County value.
US Value
(73.6%)
The regional value is compared to the national value.
Adults who have had a Routine Checkup Census Tract: 06111003011
Adults who have had a Routine Checkup Census Tract: 06111003011
60.2%
(2021)
Compared to:
CA Census Tracts
The distribution is based on data from 8,005 California census tracts.
U.S. Census Tracts
The distribution is based on data from 68,167 U.S. census tracts.
Ventura, CA County Value
(64.4%)
The regional value is compared to the Ventura County value.
US Value
(73.6%)
The regional value is compared to the national value.
Adults who have had a Routine Checkup Census Tract: 06111003012
Adults who have had a Routine Checkup Census Tract: 06111003012
63.2%
(2021)
Compared to:
CA Census Tracts
The distribution is based on data from 8,005 California census tracts.
U.S. Census Tracts
The distribution is based on data from 68,167 U.S. census tracts.
Ventura, CA County Value
(64.4%)
The regional value is compared to the Ventura County value.
US Value
(73.6%)
The regional value is compared to the national value.
Adults who have had a Routine Checkup Census Tract: 06111003013
Adults who have had a Routine Checkup Census Tract: 06111003013
61.1%
(2021)
Compared to:
CA Census Tracts
The distribution is based on data from 8,005 California census tracts.
U.S. Census Tracts
The distribution is based on data from 68,167 U.S. census tracts.
Ventura, CA County Value
(64.4%)
The regional value is compared to the Ventura County value.
US Value
(73.6%)
The regional value is compared to the national value.
Adults who have had a Routine Checkup Census Tract: 06111003100
Adults who have had a Routine Checkup Census Tract: 06111003100
59.9%
(2021)
Compared to:
CA Census Tracts
The distribution is based on data from 8,005 California census tracts.
U.S. Census Tracts
The distribution is based on data from 68,167 U.S. census tracts.
Ventura, CA County Value
(64.4%)
The regional value is compared to the Ventura County value.
US Value
(73.6%)
The regional value is compared to the national value.
Adults who have had a Routine Checkup Census Tract: 06111003201
Adults who have had a Routine Checkup Census Tract: 06111003201
55.1%
(2021)
Compared to:
CA Census Tracts
The distribution is based on data from 8,005 California census tracts.
U.S. Census Tracts
The distribution is based on data from 68,167 U.S. census tracts.
Ventura, CA County Value
(64.4%)
The regional value is compared to the Ventura County value.
US Value
(73.6%)
The regional value is compared to the national value.
Adults who have had a Routine Checkup Census Tract: 06111003300
Adults who have had a Routine Checkup Census Tract: 06111003300
61.7%
(2021)
Compared to:
CA Census Tracts
The distribution is based on data from 8,005 California census tracts.
U.S. Census Tracts
The distribution is based on data from 68,167 U.S. census tracts.
Ventura, CA County Value
(64.4%)
The regional value is compared to the Ventura County value.
US Value
(73.6%)
The regional value is compared to the national value.
Adults who have had a Routine Checkup Census Tract: 06111003605
Adults who have had a Routine Checkup Census Tract: 06111003605
61.7%
(2021)
Compared to:
CA Census Tracts
The distribution is based on data from 8,005 California census tracts.
U.S. Census Tracts
The distribution is based on data from 68,167 U.S. census tracts.
Ventura, CA County Value
(64.4%)
The regional value is compared to the Ventura County value.
US Value
(73.6%)
The regional value is compared to the national value.
Adults who have had a Routine Checkup Census Tract: 06111003608
Adults who have had a Routine Checkup Census Tract: 06111003608
59.6%
(2021)
Compared to:
CA Census Tracts
The distribution is based on data from 8,005 California census tracts.
U.S. Census Tracts
The distribution is based on data from 68,167 U.S. census tracts.
Ventura, CA County Value
(64.4%)
The regional value is compared to the Ventura County value.
US Value
(73.6%)
The regional value is compared to the national value.
Adults who have had a Routine Checkup Census Tract: 06111003609
Adults who have had a Routine Checkup Census Tract: 06111003609
68.4%
(2021)
Compared to:
CA Census Tracts
The distribution is based on data from 8,005 California census tracts.
U.S. Census Tracts
The distribution is based on data from 68,167 U.S. census tracts.
Ventura, CA County Value
(64.4%)
The regional value is compared to the Ventura County value.
US Value
(73.6%)
The regional value is compared to the national value.
Adults who have had a Routine Checkup Census Tract: 06111003612
Adults who have had a Routine Checkup Census Tract: 06111003612
63.9%
(2021)
Compared to:
CA Census Tracts
The distribution is based on data from 8,005 California census tracts.
U.S. Census Tracts
The distribution is based on data from 68,167 U.S. census tracts.
Ventura, CA County Value
(64.4%)
The regional value is compared to the Ventura County value.
US Value
(73.6%)
The regional value is compared to the national value.
Adults who have had a Routine Checkup Census Tract: 06111003700
Adults who have had a Routine Checkup Census Tract: 06111003700
58.3%
(2021)
Compared to:
CA Census Tracts
The distribution is based on data from 8,005 California census tracts.
U.S. Census Tracts
The distribution is based on data from 68,167 U.S. census tracts.
Ventura, CA County Value
(64.4%)
The regional value is compared to the Ventura County value.
US Value
(73.6%)
The regional value is compared to the national value.
Adults who have had a Routine Checkup Census Tract: 06111003801
Adults who have had a Routine Checkup Census Tract: 06111003801
57.9%
(2021)
Compared to:
CA Census Tracts
The distribution is based on data from 8,005 California census tracts.
U.S. Census Tracts
The distribution is based on data from 68,167 U.S. census tracts.
Ventura, CA County Value
(64.4%)
The regional value is compared to the Ventura County value.
US Value
(73.6%)
The regional value is compared to the national value.
Adults who have had a Routine Checkup Census Tract: 06111003802
Adults who have had a Routine Checkup Census Tract: 06111003802
57.8%
(2021)
Compared to:
CA Census Tracts
The distribution is based on data from 8,005 California census tracts.
U.S. Census Tracts
The distribution is based on data from 68,167 U.S. census tracts.
Ventura, CA County Value
(64.4%)
The regional value is compared to the Ventura County value.
US Value
(73.6%)
The regional value is compared to the national value.
Adults who have had a Routine Checkup Census Tract: 06111003900
Adults who have had a Routine Checkup Census Tract: 06111003900
56.9%
(2021)
Compared to:
CA Census Tracts
The distribution is based on data from 8,005 California census tracts.
U.S. Census Tracts
The distribution is based on data from 68,167 U.S. census tracts.
Ventura, CA County Value
(64.4%)
The regional value is compared to the Ventura County value.
US Value
(73.6%)
The regional value is compared to the national value.
Adults who have had a Routine Checkup Census Tract: 06111004000
Adults who have had a Routine Checkup Census Tract: 06111004000
59.2%
(2021)
Compared to:
CA Census Tracts
The distribution is based on data from 8,005 California census tracts.
U.S. Census Tracts
The distribution is based on data from 68,167 U.S. census tracts.
Ventura, CA County Value
(64.4%)
The regional value is compared to the Ventura County value.
US Value
(73.6%)
The regional value is compared to the national value.
Adults who have had a Routine Checkup Census Tract: 06111004101
Adults who have had a Routine Checkup Census Tract: 06111004101
58.0%
(2021)
Compared to:
CA Census Tracts
The distribution is based on data from 8,005 California census tracts.
U.S. Census Tracts
The distribution is based on data from 68,167 U.S. census tracts.
Ventura, CA County Value
(64.4%)
The regional value is compared to the Ventura County value.
US Value
(73.6%)
The regional value is compared to the national value.
Adults who have had a Routine Checkup Census Tract: 06111004200
Adults who have had a Routine Checkup Census Tract: 06111004200
60.6%
(2021)
Compared to:
CA Census Tracts
The distribution is based on data from 8,005 California census tracts.
U.S. Census Tracts
The distribution is based on data from 68,167 U.S. census tracts.
Ventura, CA County Value
(64.4%)
The regional value is compared to the Ventura County value.
US Value
(73.6%)
The regional value is compared to the national value.
Adults who have had a Routine Checkup Census Tract: 06111004304
Adults who have had a Routine Checkup Census Tract: 06111004304
64.7%
(2021)
Compared to:
CA Census Tracts
The distribution is based on data from 8,005 California census tracts.
U.S. Census Tracts
The distribution is based on data from 68,167 U.S. census tracts.
Ventura, CA County Value
(64.4%)
The regional value is compared to the Ventura County value.
US Value
(73.6%)
The regional value is compared to the national value.
Adults who have had a Routine Checkup Census Tract: 06111004305
Adults who have had a Routine Checkup Census Tract: 06111004305
52.6%
(2021)
Compared to:
CA Census Tracts
The distribution is based on data from 8,005 California census tracts.
U.S. Census Tracts
The distribution is based on data from 68,167 U.S. census tracts.
Ventura, CA County Value
(64.4%)
The regional value is compared to the Ventura County value.
US Value
(73.6%)
The regional value is compared to the national value.
Adults who have had a Routine Checkup Census Tract: 06111004400
Adults who have had a Routine Checkup Census Tract: 06111004400
61.3%
(2021)
Compared to:
CA Census Tracts
The distribution is based on data from 8,005 California census tracts.
U.S. Census Tracts
The distribution is based on data from 68,167 U.S. census tracts.
Ventura, CA County Value
(64.4%)
The regional value is compared to the Ventura County value.
US Value
(73.6%)
The regional value is compared to the national value.
Adults who have had a Routine Checkup Census Tract: 06111004503
Adults who have had a Routine Checkup Census Tract: 06111004503
56.9%
(2021)
Compared to:
CA Census Tracts
The distribution is based on data from 8,005 California census tracts.
U.S. Census Tracts
The distribution is based on data from 68,167 U.S. census tracts.
Ventura, CA County Value
(64.4%)
The regional value is compared to the Ventura County value.
US Value
(73.6%)
The regional value is compared to the national value.
Adults who have had a Routine Checkup Census Tract: 06111004504
Adults who have had a Routine Checkup Census Tract: 06111004504
59.3%
(2021)
Compared to:
CA Census Tracts
The distribution is based on data from 8,005 California census tracts.
U.S. Census Tracts
The distribution is based on data from 68,167 U.S. census tracts.
Ventura, CA County Value
(64.4%)
The regional value is compared to the Ventura County value.
US Value
(73.6%)
The regional value is compared to the national value.
Adults who have had a Routine Checkup Census Tract: 06111004505
Adults who have had a Routine Checkup Census Tract: 06111004505
58.8%
(2021)
Compared to:
CA Census Tracts
The distribution is based on data from 8,005 California census tracts.
U.S. Census Tracts
The distribution is based on data from 68,167 U.S. census tracts.
Ventura, CA County Value
(64.4%)
The regional value is compared to the Ventura County value.
US Value
(73.6%)
The regional value is compared to the national value.
Adults who have had a Routine Checkup Census Tract: 06111004506
Adults who have had a Routine Checkup Census Tract: 06111004506
53.8%
(2021)
Compared to:
CA Census Tracts
The distribution is based on data from 8,005 California census tracts.
U.S. Census Tracts
The distribution is based on data from 68,167 U.S. census tracts.
Ventura, CA County Value
(64.4%)
The regional value is compared to the Ventura County value.
US Value
(73.6%)
The regional value is compared to the national value.
Adults who have had a Routine Checkup Census Tract: 06111004600
Adults who have had a Routine Checkup Census Tract: 06111004600
52.1%
(2021)
Compared to:
CA Census Tracts
The distribution is based on data from 8,005 California census tracts.
U.S. Census Tracts
The distribution is based on data from 68,167 U.S. census tracts.
Ventura, CA County Value
(64.4%)
The regional value is compared to the Ventura County value.
US Value
(73.6%)
The regional value is compared to the national value.
Adults who have had a Routine Checkup Census Tract: 06111004704
Adults who have had a Routine Checkup Census Tract: 06111004704
59.9%
(2021)
Compared to:
CA Census Tracts
The distribution is based on data from 8,005 California census tracts.
U.S. Census Tracts
The distribution is based on data from 68,167 U.S. census tracts.
Ventura, CA County Value
(64.4%)
The regional value is compared to the Ventura County value.
US Value
(73.6%)
The regional value is compared to the national value.
Adults who have had a Routine Checkup Census Tract: 06111004710
Adults who have had a Routine Checkup Census Tract: 06111004710
59.5%
(2021)
Compared to:
CA Census Tracts
The distribution is based on data from 8,005 California census tracts.
U.S. Census Tracts
The distribution is based on data from 68,167 U.S. census tracts.
Ventura, CA County Value
(64.4%)
The regional value is compared to the Ventura County value.
US Value
(73.6%)
The regional value is compared to the national value.
Adults who have had a Routine Checkup Census Tract: 06111004711
Adults who have had a Routine Checkup Census Tract: 06111004711
62.8%
(2021)
Compared to:
CA Census Tracts
The distribution is based on data from 8,005 California census tracts.
U.S. Census Tracts
The distribution is based on data from 68,167 U.S. census tracts.
Ventura, CA County Value
(64.4%)
The regional value is compared to the Ventura County value.
US Value
(73.6%)
The regional value is compared to the national value.
Adults who have had a Routine Checkup Census Tract: 06111004715
Adults who have had a Routine Checkup Census Tract: 06111004715
59.8%
(2021)
Compared to:
CA Census Tracts
The distribution is based on data from 8,005 California census tracts.
U.S. Census Tracts
The distribution is based on data from 68,167 U.S. census tracts.
Ventura, CA County Value
(64.4%)
The regional value is compared to the Ventura County value.
US Value
(73.6%)
The regional value is compared to the national value.
Adults who have had a Routine Checkup Census Tract: 06111004716
Adults who have had a Routine Checkup Census Tract: 06111004716
58.8%
(2021)
Compared to:
CA Census Tracts
The distribution is based on data from 8,005 California census tracts.
U.S. Census Tracts
The distribution is based on data from 68,167 U.S. census tracts.
Ventura, CA County Value
(64.4%)
The regional value is compared to the Ventura County value.
US Value
(73.6%)
The regional value is compared to the national value.
Adults who have had a Routine Checkup Census Tract: 06111004717
Adults who have had a Routine Checkup Census Tract: 06111004717
57.2%
(2021)
Compared to:
CA Census Tracts
The distribution is based on data from 8,005 California census tracts.
U.S. Census Tracts
The distribution is based on data from 68,167 U.S. census tracts.
Ventura, CA County Value
(64.4%)
The regional value is compared to the Ventura County value.
US Value
(73.6%)
The regional value is compared to the national value.
